You're Protected by our 30 Day Money Back Guarantee. If you aren't completely satisfied with your purchase, contact our support team at [email protected] within 30 days from the time of your purchase and we will refund your purchase in full.
Bonus: LIVE Weekly Coaching with Vlad
People have said the most valuable part of their Tradespoon membership is the active coaching we give to our students when they have questions and need help. And while it's definitely a huge time-investment for us, we do it because it provides maximum benefit to our members, while also keeping us sharp.
Since Vlad wanted to make sure you hit the ground running, he's authorized me to throw in FREE access to our Weekly LIVE Trading Workshops and Coaching!
This is a $297 value... but it's yours absolutely free when you sign up today.
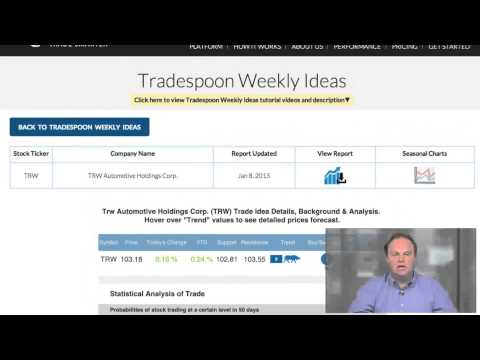
Click here to hide Tradespoon Focus List tutorial videos and description ▲
Click here to view Tradespoon Focus List tutorial videos and description ▼
Probability Calculator
The Probability Calculator may help determine the likelihood of an underlying stock trading above, below, or between certain price targets on a specified date.
This calculator also includes the short term trend consisting of 2 different quant models that run independently for 20,30 ,40 and 50 days forecast.
The output is generated by predictive models that forecast the stock price movement for 20 ,30,40 and 50 days from now.
Seasonal Charts
The Seasonal Charts Tool allows you to review graphs depicting the historical performance of each stock to help forecast future performance. See how a stock has performed historically and will likely fare under different political, economic, fundamental and technical conditions. This tool may help you:
Decide which side of the market you should be on
Estimate how long up-trends and down-trends are likely to last
Approximate where tops and bottoms are likely to occur so that you can set buy and sell stops
Determine which price "blips" are indicator whipsaws that might produce trading losses
 Special Offer: Try the 'Tradespoon LIVE Membership' for ONLY $37!
CLICK HERE TO LEARN MORE
Special Offer: Try the 'Tradespoon LIVE Membership' for ONLY $37!
CLICK HERE TO LEARN MORE