RoboStreet – August 11, 2022
Following CPI Data, Markets Begin to Slide after Hitting Highs
After reaching a three-month high this week following yet another batch of inflation data, stocks in the U.S. ended mostly lower on Thursday which suggested that skyrocketing gains may be slowing down. At the midweek point, all three major U.S. indices booked impressive gains, with the Nasdaq touching bull territory. As the back and forth continues, our opinion on the market still holds strong – the latest boom was simply a rally in a bear market.
On Thursday, the more optimistic CPI reading came after a similarly chilly-than-expected reading on consumer price growth was released the day before. Despite an early morning advance to their highest levels since early May, stocks tumbled into the closing bell on Thursday, after the July producer-price index declined 0.5 percent compared with forecasts for a 0.2 percent increase.
Next week, look out for key retail and housing data to be released. With the majority of earnings behind us we expect the dust to settle and the potential for the bull market to return to increase. The latest rise in the market is not an indication that the bull market has begun, as I’ve previously stated. Rather, encouraging earnings and better-than-expected economic reports appear to be propelling the advance, suggesting we’re still in a bear market. To confirm, let’s inspect the current market conditions.
And remember we’re not talking about day-trading here. I’m looking for 50-100% gains inside the next 3 months, so my weekly updates are timely enough for you to act.
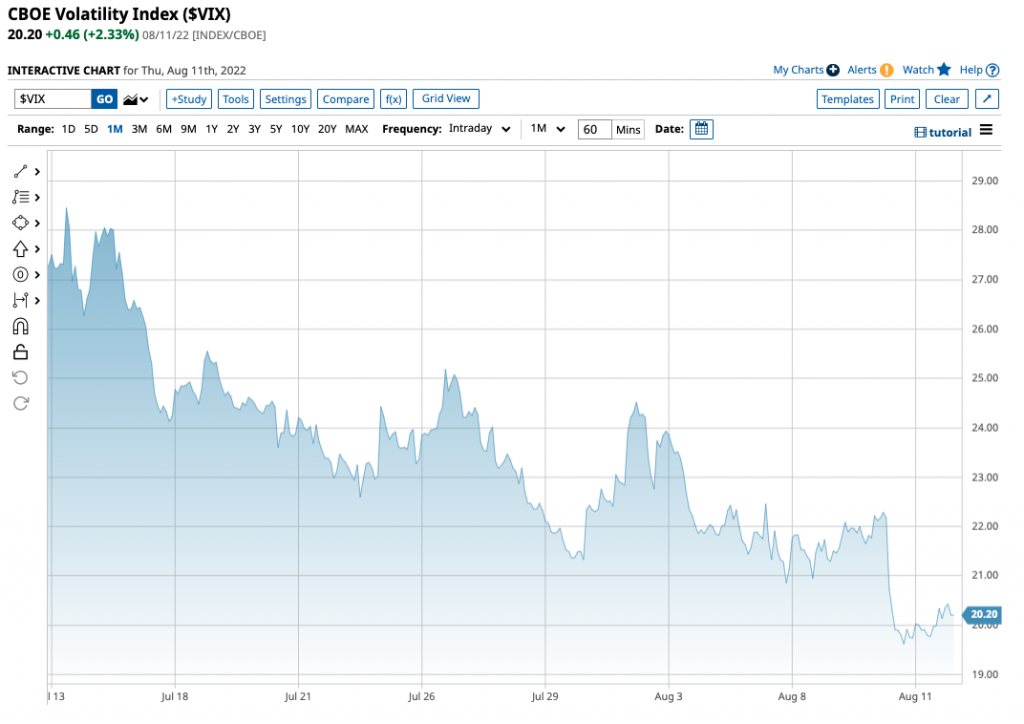
On Thursday, $VIX rose higher, nearing the $20 level, after modest weekly gains which approached $22. We’ll be keeping an eye on the volatility index as we enter a period of uncertainty following earnings season when the dust has settled on recent reporting.
Looking at the SPY Seasonal Chart, I expect the market to continue the short-term rally for the next couple of weeks but is likely to come to an end in August. Downward momentum could resume as early as September, going into the October time frame.
Overhead resistance levels in the SPY are presently at $420 and then $430. The $SPY support is at $406 and then $401.
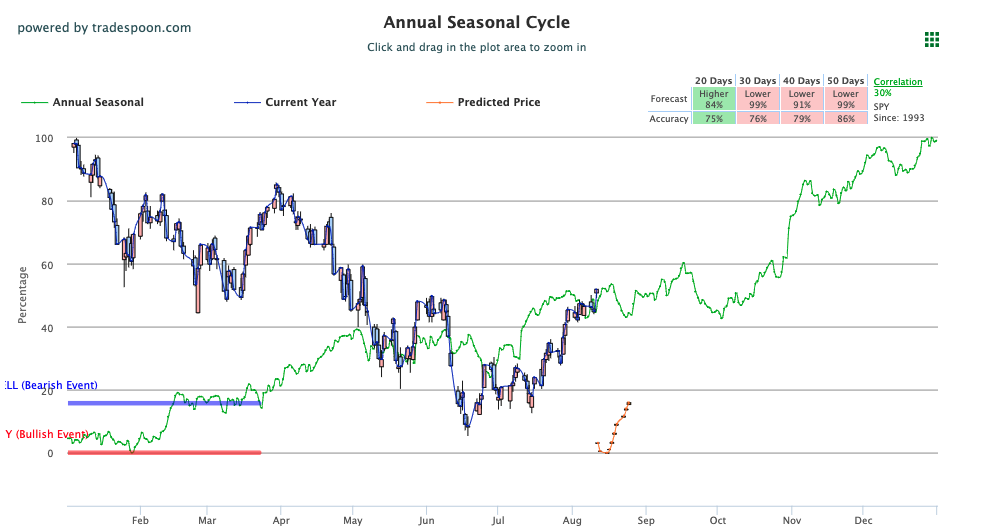
I predict that the market will be volatile, and I urge customers not to chase it and sell into its rallies. The market is overbought, as several indicators allude to, and I believe the market has been building a top that can make marginal highs but risks a large downside. I expect the sell-off to resume sooner rather than later.
Still, there are opportunities to be had during this time. Specifically, I am eyeing one sector and one symbol with impressive results following their earnings report. Not only is this symbol supported by the latest trends but also using historical performance, I am seeing several indicators pointing at this symbol.

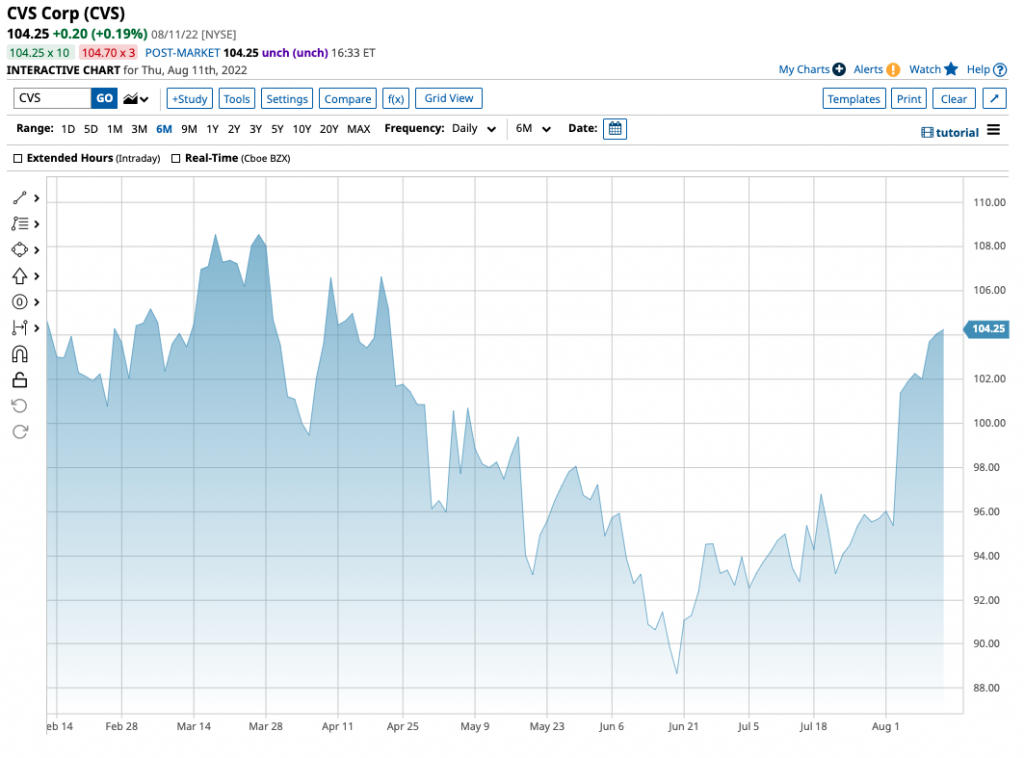
CVS Health Corporation, the American healthcare company overseeing CVS Pharmacy and CVS Caremark, released earnings last week which saw the company raise its full-year forecast and easily top second-quarter estimates. Several factors caused the symbol to boom, including the 8% increase in in-store sales and the increase in reported net income. Following the Q2 reports, shares of CVS jumped from $95.37 to $101.38.
This impressive movement caught my attention. When looking at the historical data, I am seeing similar positive trends.
Running CVS through Tradespoon’s elite A.I. tools I am seeing several signs I like. In just the past couple of days, the Tradespoon Seasonal Chart is showing four “higher” probability readings for the next 30 and 40-day periods. There is a noticeable gap between the annual seasonal price, seen by the green line, as compared to the current price, portrayed via the blue line. CVS Seasonal Chart:
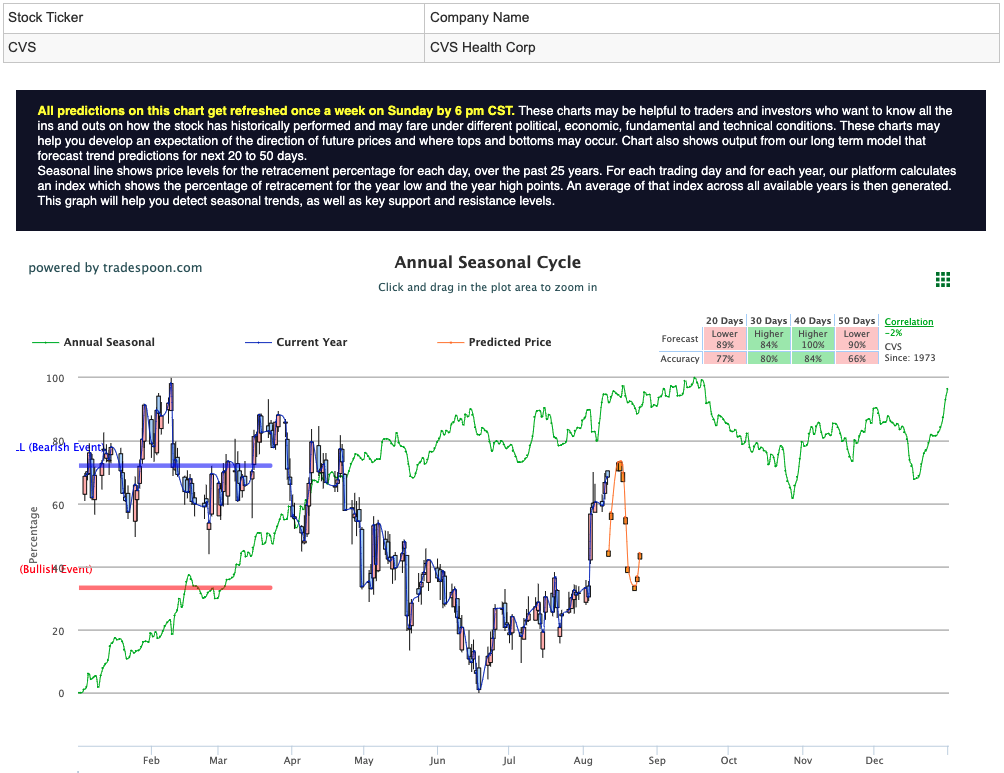
Looking at the 10-day Stock Forecast Toolbox predicted data, we see a similar reading that shows the potential for this symbol to grow. Current CVS pricing is right between our resistance prediction, $106.76, and above predicted support at $102.88.
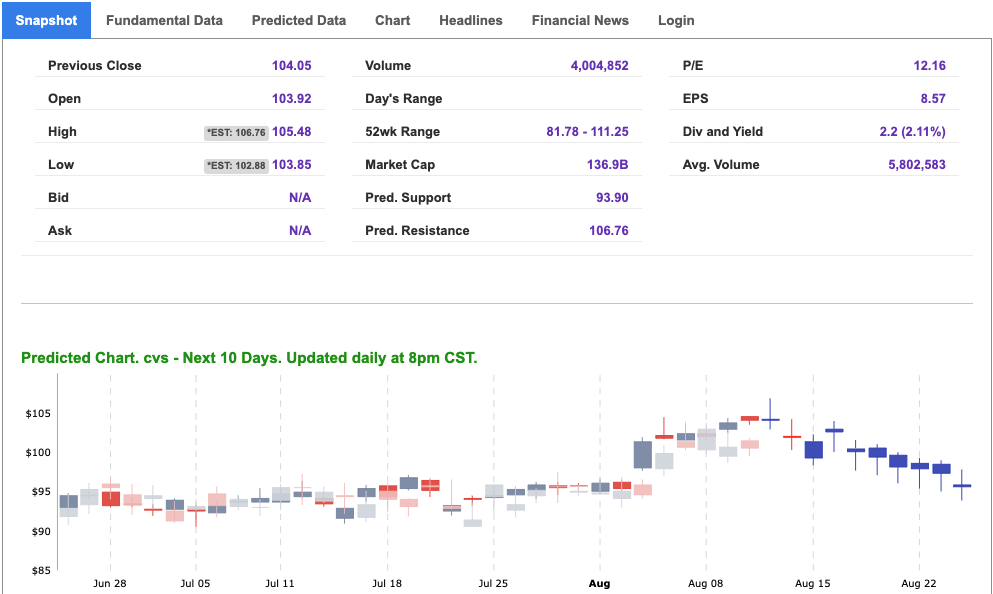
Over the last 6 months, CVS is up 1.25% but still off highs, near $109 territory. With the current market conditions looking overbought while maintaining some runaway for additional rallies in this bear market, I am betting on healthcare to catch up and make some waves these next few weeks.
The market usually favors dividend-paying healthcare stocks; likewise, recent history has shown the emergency of covid strands and LOW PE stocks with healthy dividends perform well. Looking through a long-term historical view, healthcare has outperformed in down markets. After reviewing with our A.I. tools, CVS was a BUY signal on both short-term and long-term models.
This is what the power of AI can do for us, as well as for members of our RoboInvestor stock and ETF advisory service. Our proprietary AI platform identifies trades with a high probability of profits and cuts out all the noise and emotion that typically drives investor behavior. We email subscribers an online newsletter every other week, over the weekend, that includes my fundamental commentary on the market landscape, a technical read on near-term market direction, an update on current positions, and one or two new recommendations to act on when the market opens Monday.
RoboInvesetor is an unrestricted investment service, in that I may recommend blue-chip stocks or ETFs that represent the major indexes, market sectors, sub-sectors, commodities, currencies, interest rates, volatility, and shorting opportunities through the use of inverse ETFs. Our model portfolio will hold between 12 and 25 positions, depending on market conditions. Lately, we’ve been entirely more cautious with a smaller number of stocks and ETFs.
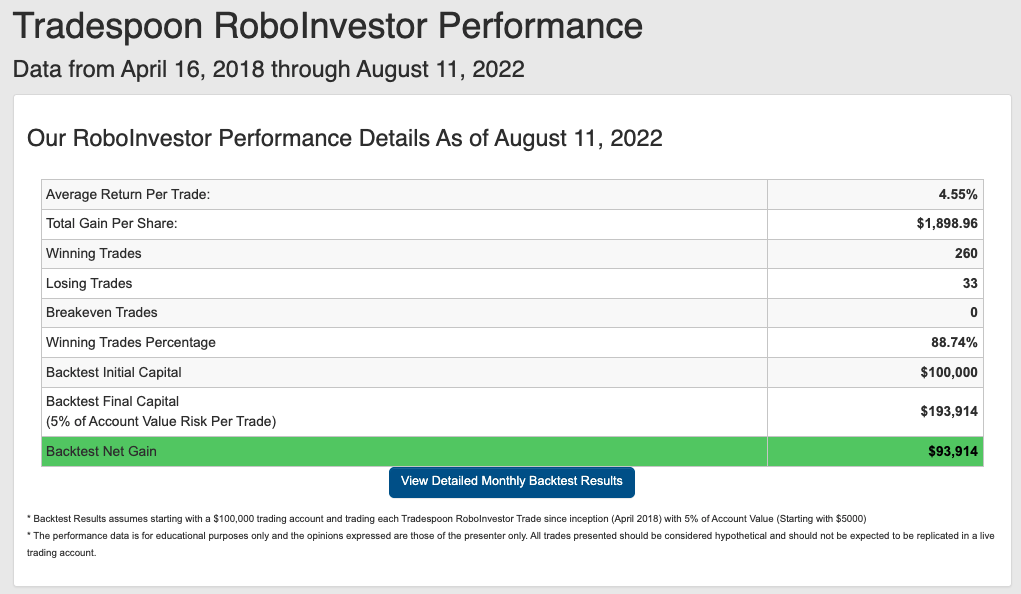
Our track record is one of the very best in the retail advisory industry, where our Winning Trades Percentage is at 88.74% going back to April 2018.
The market continues to shape up to be as unpredictable as I’ve seen since the pandemic broke out in early 2020 – and we still have more than 5 months to go! Inflation, upcoming Fed decisions, geopolitical tension, and the Ukraine war – all factor into how money is being made and lost. Don’t go at it alone in this investing landscape, but instead, put RoboInvestor to work today and add a big layer of confidence to your portfolio going into tomorrow. We’ll be with you every step of the way!
And remember we’re not talking about day-trading here. I’m looking for 50-100% gains inside the next 3 months, so my weekly updates are timely enough for you to act.
*Please note: RoboStreet is part of your free subscription service. It is not included in any paid Tradespoon subscription service. Vlad Karpel only trades his own personal money in paid subscription services. If you are a paid subscriber, please review your Premium Member Picks, ActiveTrader, MonthlyTrader, or RoboInvestor recommendations. If you are interested in receiving Vlad’s personal picks, please click here.
Comments Off on
Tradespoon Tools make finding winning trades in minute as easy as 1-2-3.
Our simple 3 step approach has resulted in an average return of almost 20% per trade!