In an electrifying start to the week, Monday witnessed the three major stock indexes achieving unprecedented highs for 2023. This triumph marked the extension of the S&P 500’s remarkable six-week winning streak, showcasing the index’s resilience in the face of a dynamically shifting economic landscape.
What makes this feat particularly impressive is the context of prevailing concerns regarding high interest rates potentially impeding economic growth. Despite these anxieties, the S&P 500’s ability to reach new highs underscores the market’s confidence, albeit cautious, in the overall economic outlook.
Looking ahead, the market braces for impactful data releases, beginning with Tuesday’s consumer price index (CPI). With economists predicting a 3% year-over-year increase, down from 3.2% the previous month, this data holds sway over expectations for monetary easing.
Investors closely monitor Fed-fund futures, indicating a shift in sentiment with reduced expectations for a March interest rate cut, now at a 50% likelihood for May. Despite a brief pause in U.S. stock futures on Monday, the market anticipates a busy week with significant economic data releases and the Federal Reserve’s awaited monetary policy decision.
Approaching 2024, a market-neutral stance appears prudent, acknowledging potential short-term pullbacks. Current indicators suggest a low likelihood of a recession, prompting a reassessment of the market outlook. The S&P 500 rally, potentially capped within the $450-470 range, is expected to find short-term support levels between 400-430 in the coming months. For reference, the SPY Seasonal Chart is shown below:
While the peak of the rally may be behind us, the market actively seeks a catalyst for further ascent. The upcoming weeks, featuring crucial economic indicators and insights from Powell’s statements, promise to unveil the market’s trajectory. A cautious approach aligns with the nuanced economic landscape, emphasizing the need for a catalyst to sustain upward momentum.

Using the “SPY” symbol to analyze the S&P 500 our 10-day prediction window shows a near-term positive outlook. Prediction data is uploaded after the market closes at 6 p.m. CST. Today’s data is based on market signals from the previous trading session.
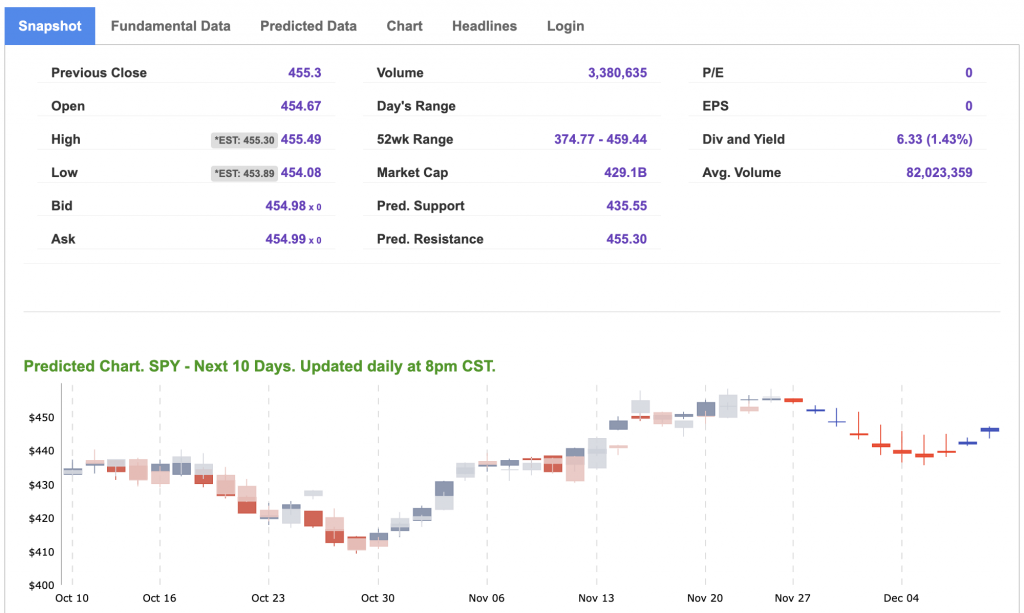
Note: The Vector column calculates the change of the Forecasted Average Price for the next trading session relative to the average of actual prices for the last trading session. The column shows the expected average price movement “Up or Down”, in percent. Trend traders should trade along the predicted direction of the Vector. The higher the value of the Vector the higher its momentum.
*Please note: At the time of publication Vlad Karpel does NOT have a position in the featured symbol, slv. Our featured symbol is part of your free subscription service. It is not included in any paid Tradespoon subscription service. Vlad Karpel only trades his money in paid subscription services. If you are a paid subscriber, please review your Premium Member Picks, ActiveTrader, or MonthlyTrader recommendations. If you are interested in receiving Vlad’s picks, please click here.
West Texas Intermediate for Crude Oil delivery (CL.1) is priced at $71.40 per barrel, up 0.24%, at the time of publication.
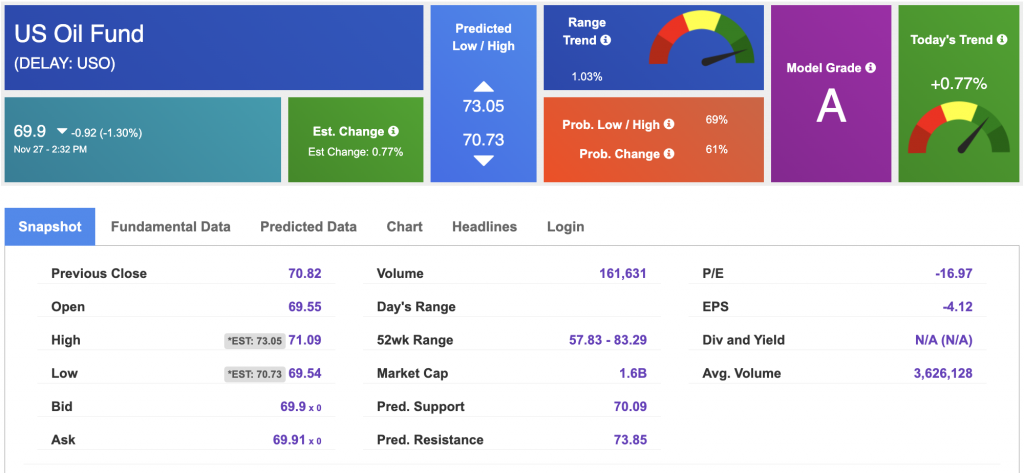
Looking at USO, a crude oil tracker, our 10-day prediction model shows mixed signals. The fund is trading at $69.9 at the time of publication. Prediction data is uploaded after the market close at 6 p.m., CST. Today’s data is based on market signals from the previous trading session.
The price for the Gold Continuous Contract (GC00) is down 0.84% at $1997.60 at the time of publication.
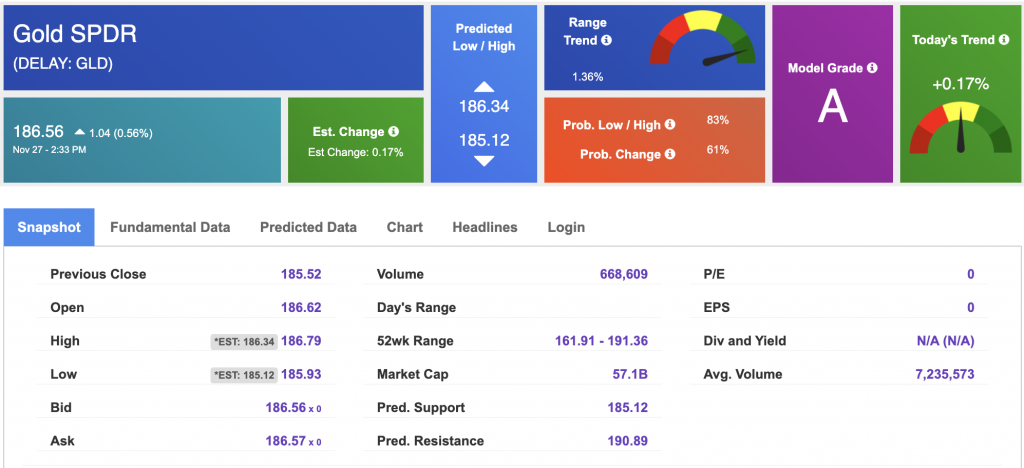
Using SPDR GOLD TRUST (GLD) as a tracker in our Stock Forecast Tool, the 10-day prediction window shows mixed signals. The gold proxy is trading at $186.56 at the time of publication. Vector signals show +0.17% for today. Prediction data is uploaded after the market close at 6 p.m., CST. Today’s data is based on market signals from the previous trading session.
The yield on the 10-year Treasury note is up at 4.236% at the time of publication.
The yield on the 30-year Treasury note is up at 4.328% at the time of publication.
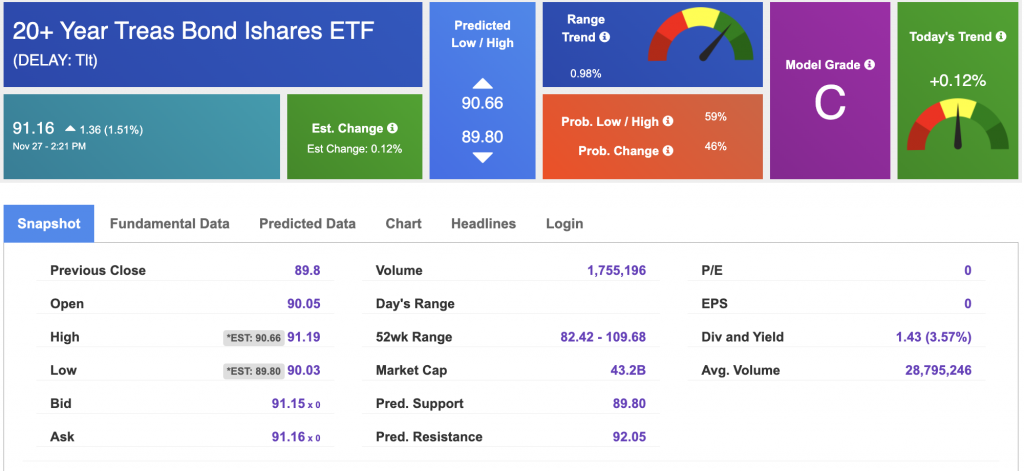
Using the iShares 20+ Year Treasury Bond ETF (TLT) as a proxy for bond prices in our Stock Forecast Tool, we see mixed signals in our 10-day prediction window. Prediction data is uploaded after the market close at 6 p.m., CST. Today’s data is based on market signals from the previous trading session.
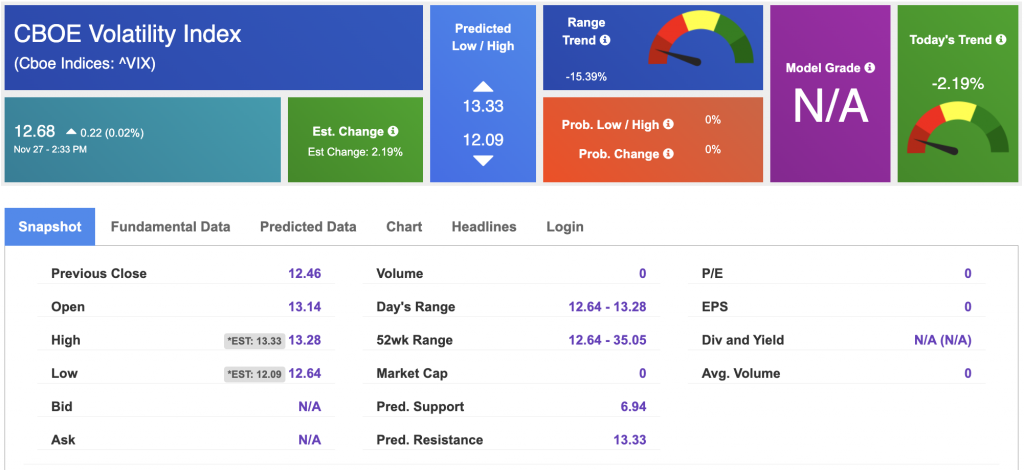
The CBOE Volatility Index (^VIX) is priced at $12.68 up 0.02% at the time of publication, and our 10-day prediction window shows mixed signals. Prediction data is uploaded after the market close at 6 p.m., CST. Today’s data is based on market signals from the previous trading session.
Comments Off on
Tradespoon Tools make finding winning trades in minute as easy as 1-2-3.
Our simple 3 step approach has resulted in an average return of almost 20% per trade!