RoboStreet – October 27, 2022
Tech Earnings Underperform, GDP Data Returns Strong
Markets were supported this week by better-than-expected GDP data; however, tech shares felt pressure after some earnings reports fell short of expectations. As the Dow Jones was able to book five straight sessions of gains on Thursday, the tech-heavy Nasdaq slipped throughout the week as tech earnings continued to show signs of weakness. Meta Platforms’ poor showing had investors on edge before earnings reports from Apple Inc. and Amazon.com. However, the GDP report was able to offer some support as the U.S. economy was reported to grow 2.6% in the third quarter.
Although recession concerns remain, the latest GDP report did some positive data on the state of the economy. First and foremost, consumer spending remained steady throughout the year. Following two troubling GDP reports in 2022, any Q3 data that remained positive was notably impactful. GDP data is due to still get updated but additional key figures include a decline from the record high trade deficit (exports up 14.4%, imports down 6.9%,) government spending was up 2.4%, and the rate of inflation was down at an annual 4.2%.
And remember we’re not talking about day trading here. I’m looking for 50-100% gains within the next 3 months, so my weekly updates are timely enough for you to act.
The GDP report offered substantial support ahead of what could be another market-supporting event: midterm elections. Any clarity regarding how the government will move going forward should help the trading landscape going forward. Still, we’ve seen several signs of concerns that could imprint a bigger impact in the final weeks of 2022.
Following underwhelming Q3 earnings reports from Microsoft and Google’s parent company, Alphabet Inc., on Tuesday, the Nasdaq slumped significantly and saw similar tech and comm shares slide. Apple and Amazon are due after the market closes on Thursday but have sold off ahead of their respective reports.
Next week, economic releases will be headlined by the latest Federal Open Market Committee policy update. The two-day meeting will wrap on Wednesday with Fed Chair Powell announcing any updates and guidance available. Additional key reports include October ADP employment, unemployment, average hourly earnings, and the ISM manufacturing index. Earnings in focus next week will primarily feature retail and energy sector names.
Also worth noting, U.S. yields remain in focus with long-term yields having recently spiked to record highs. The short 2-year yield has traded near 4.0%, while the 10-year yield pulled back to 4.0% after trading much higher.
Globally, there is still a lack of liquidity in the marketplace. Japan and U.K. have shown this with their currency’s latest levels while just recently the Chinese Yan hit historically high levels. In China, XI was re-elected for 3rd term (and probably for as long as he wants) which pushed the Yuan. China is selling US Dollars which did somewhat impact the strong dollar negatively.
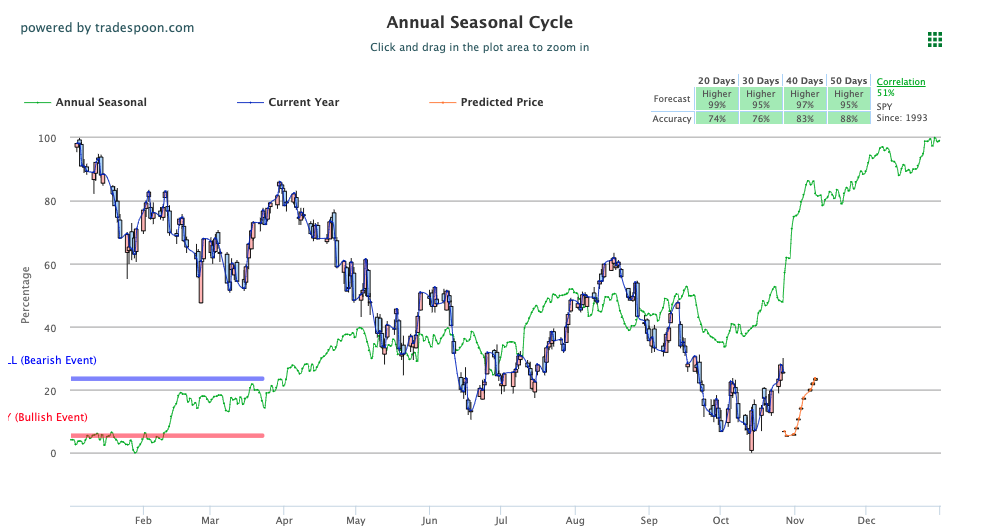
Looking at the latest levels in the market in accordance with our A.I. forecasts, I am watching the SPY overhead resistance at $390 and then $400. Support for the SPY is at $380 and then $370. See SPY Seasonal Chart below:

With this in mind, I believe the market could continue the current rally for the next 4-8 weeks. The short-term market is overbought and can pull back. I would be a buyer into any further sell-offs and have encouraged subscribers not to chase the market to the downside.
As it stands, the market sentiment appears to be split. Inflation remains high and the dollar is strong, however, the hope of a Fed pivoting its intended direction and rate hikes have been bubbling up as of late. So far, shares like General Motors and Visa have shown resilience in their earning results. However, tech giants like Google and Microsoft are showing revenue decline and signs of concern. As long as the SPY remains above its recent lows, I believe the market would remain on the move higher.
Rallies could be staged and it would be prudent to find proper sectors to benefit from. This week, I’ve found one particular sector and symbol which I am going to keep an eye on and potentially get involved with at the right price.
With the latest tech dip in place and several opportunities for the market to stage a rally, I am going to go off a traditional historical trend in finding support for the strength of semiconductors. A crucial part of our 21st-century world. And when it comes to semiconductors, there is one symbol that comes to mind.

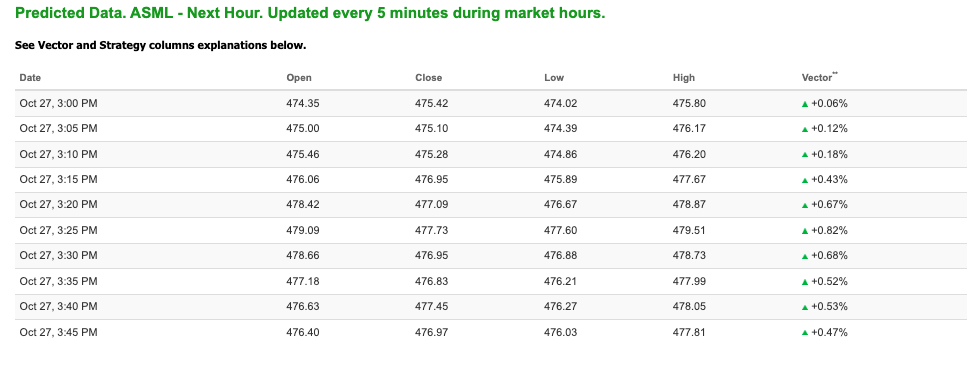
ASML Holding (ASML) is one of the premier semiconductor and materials brands and is a worldwide staple. The symbol is trading above $474 and on the lower end of its 52-week range of $363-$881. Although shares sold off on Thursday, which is understandable following the tech selloff, ASML had a decent week. There is plenty of room to the upside for this symbol and the technical levels we’ve seen this symbol trade within are promising for any potential rallies that could come.
With the fundamentals in place for semiconductors to benefit, let’s review our A.I. toolset.


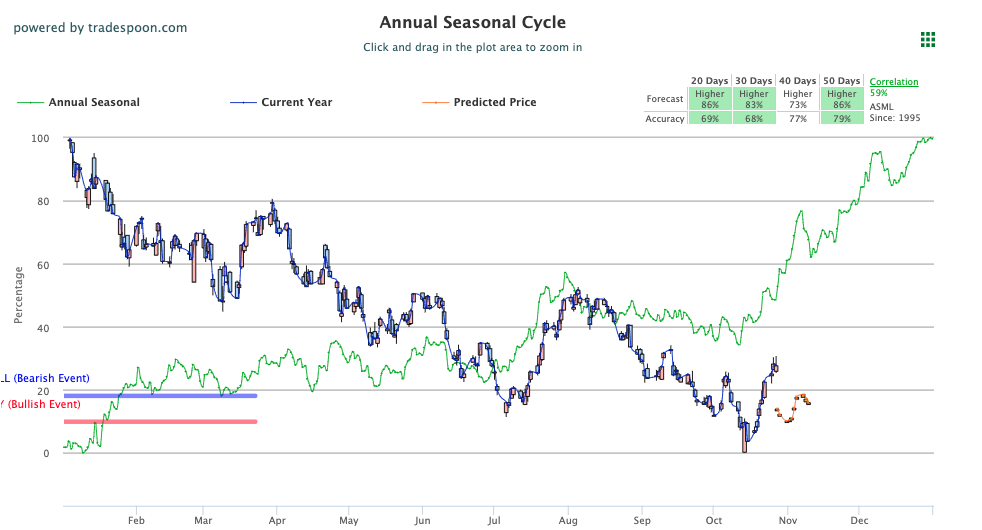
Looking into the Seasonal Chart of $ASML, we see several additional positive indicators. Specifically, the symbol looks like it could go up in all four time periods on the Seasonal Chart forecast, which is great news. Not only does it look like the symbol will go up over the next 20, 30, 40, and 50 days, but its accuracy score is also increasing steadily. See ASML Seasonal Chart below:

As the focus remains on earnings and the upcoming midterm elections, I would be a buyer of any pullbacks. Looking at next week’s FOMC, investors expect a 75 basis point increase in the November meeting. The pathway to moving higher for semiconductors is out there and my A.I. models are agreeing with the sentiment regarding the sector’s potential.
This is what the power of AI can do for us, as well as for members of our RoboInvestor stock and ETF advisory service. Our proprietary AI platform identifies trades with a high probability of profits and cuts out all the noise and emotion that typically drives investor behavior.
We email subscribers an online newsletter every other week, over the weekend, that includes my fundamental commentary on the market landscape, a technical read on near-term market direction, an update on current positions, and one or two new recommendations to act on when the market opens Monday.
RoboInvesetor is an unrestricted investment service, in that I may recommend blue-chip stocks or ETFs that represent the major indexes, market sectors, sub-sectors, commodities, currencies, interest rates, volatility, and shorting opportunities through the use of inverse ETFs. Our model portfolio will hold between 12 and 25 positions, depending on market conditions. Lately, we’ve been entirely more cautious with a smaller number of stocks and ETFs.
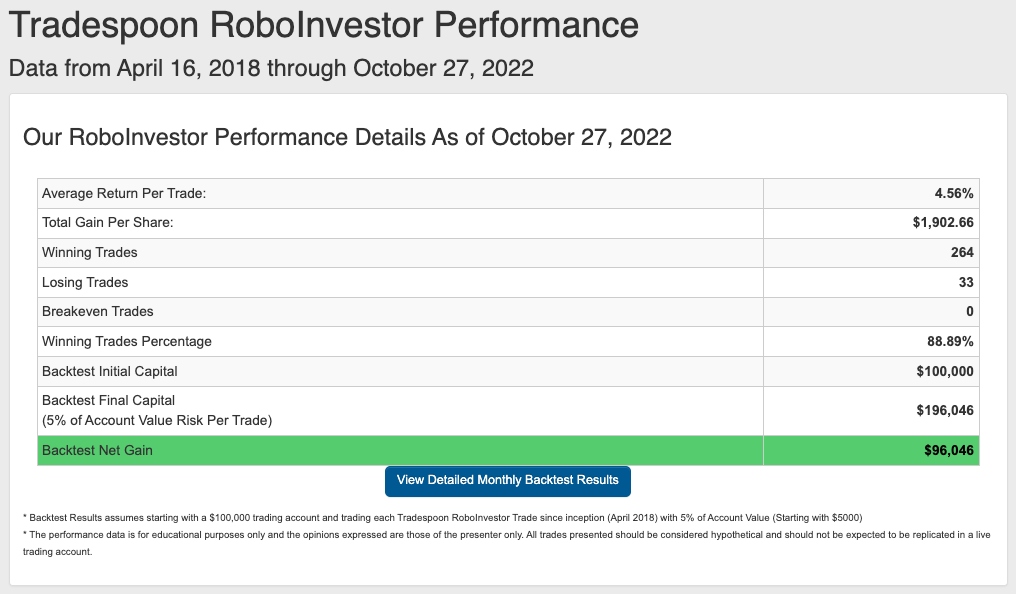
Our track record is one of the very best in the retail advisory industry, where our Winning Trades Percentage is at 88.89% going back to April 2018.

The market continues to shape up to be as unpredictable as I’ve seen since the pandemic broke out in early 2020 – and we just started Q4! Inflation, Fed decisions, geopolitical tension, and the Ukraine war – all factor into how money is being made and lost. Don’t go at it alone in this investing landscape, but instead, put RoboInvestor to work today and add a big layer of confidence to your portfolio going into tomorrow. We’ll be with you every step of the way!
And remember we’re not talking about day trading here. I’m looking for 50-100% gains within the next 3 months, so my weekly updates are timely enough for you to act.
*Please note: RoboStreet is part of your free subscription service. It is not included in any paid Tradespoon subscription service. Vlad Karpel only trades his own personal money in paid subscription services. If you are a paid subscriber, please review your Premium Member Picks, ActiveTrader, MonthlyTrader, or RoboInvestor recommendations. If you are interested in receiving Vlad’s personal picks, please click here.
Comments Off on
Tradespoon Tools make finding winning trades in minute as easy as 1-2-3.
Our simple 3 step approach has resulted in an average return of almost 20% per trade!