 Special Offer: Try the 'ShadowTrader Membership' for ONLY $37!
CLICK HERE TO LEARN MORE
Special Offer: Try the 'ShadowTrader Membership' for ONLY $37!
CLICK HERE TO LEARN MORE
U.S. stocks opened on a positive note Wednesday as investors reacted to key inflation data from the Consumer Price Index (CPI). However, the initial optimism quickly gave way to caution, with markets fluctuating throughout the day as traders grappled with the implications of these economic reports.
The Bureau of Labor Statistics released its July CPI data, showing that inflation rose by 2.9% year-over-year, slightly below the expected 3% increase. This marks the smallest annual rise since March 2021, indicating that inflationary pressures might be easing after months of heightened concern.
On a monthly basis, headline inflation increased by 0.2%, meeting economists’ expectations. Core inflation, which excludes the more volatile categories of food and energy, also saw a 0.2% month-over-month rise and a 3.2% increase year-over-year—both figures in line with predictions.
This CPI data follows Tuesday’s release of the Producer Price Index (PPI), which offered further evidence of cooling inflation. The PPI, a measure of wholesale prices, edged up by just 0.1% in July, down from June’s 0.2% increase, and below the 0.2% gain anticipated by economists. On a year-over-year basis, the PPI rose by 2.2%, down from 2.6% in June.
Core PPI, which excludes food and energy prices, remained flat in July, a notable slowdown from June’s revised 0.3% increase. The annual increase in core PPI stood at 2.4%, down from the previously reported 3%, further suggesting that inflation at the wholesale level may be losing momentum.
The softer inflation readings from both the CPI and PPI have intensified speculation that the Federal Reserve may be inclined to cut interest rates sooner rather than later. Market sentiment is shifting, with a growing expectation that the Federal Open Market Committee (FOMC) might reduce its target for the federal funds rate by 50 basis points at its September meeting—a move now seen as having a 41.5% probability.
The debate over the size of the rate cut is heating up, with some advocating for a more aggressive half-point reduction to counterbalance the apparent economic slowdown. The cooling in consumer and producer prices is being interpreted by some as an early warning sign that the U.S. economy may be decelerating more quickly than expected, potentially prompting the Fed to take more decisive action.
Despite the favorable inflation data, the stock market’s response has been tepid. Equities hovered near the breakeven line for much of the day as investors weighed the positive aspects of cooling inflation against broader economic concerns. Bond yields rose slightly, reflecting the market’s uncertainty about the Federal Reserve’s next steps.
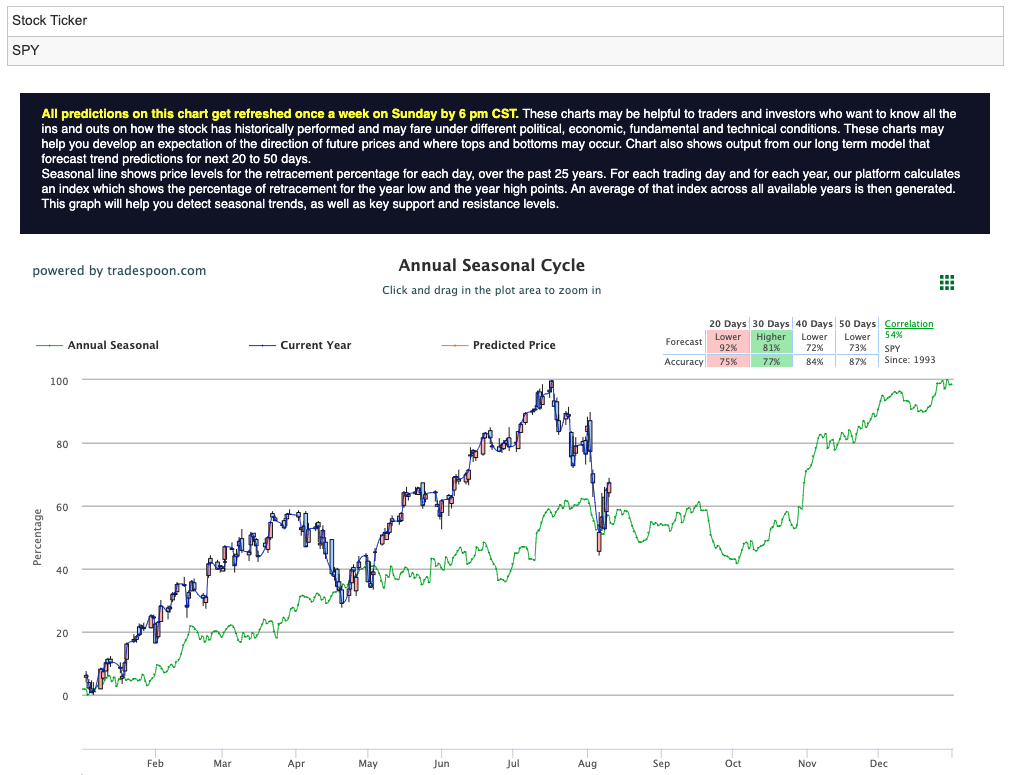
The recent rally in tech stocks, which had been driving market gains, began to stall as broader market resistance emerged. The SPY, an ETF tracking the S&P 500, is facing resistance in the $560-$575 range, with support identified between $480 and $510. This suggests that the market may be entering a period of sideways trading in the short to medium term. For reference, the SPY Seasonal Chart is shown below:
The road ahead for the stock market is fraught with challenges. While cooling inflation offers some relief, the broader economic outlook is increasingly uncertain. Unemployment is edging higher, and concerns are mounting about the stability of smaller banks with significant exposure to commercial and residential real estate. Additionally, geopolitical tensions, particularly in the Middle East, have added another layer of risk, particularly in energy markets.
Given these complexities, a market-neutral stance may be prudent as investors navigate this uncertain environment. While the recent earnings season has exceeded expectations, providing some support to the market, the looming risk of a recession cannot be ignored. As the Federal Reserve deliberates its next move, investors should remain vigilant and prepared for potential volatility.
In summary, the latest U.S. inflation data suggests that price pressures are easing, but the broader economic outlook remains clouded by uncertainty. The stock market’s cautious response reflects the delicate balance between optimism over potential interest rate cuts and concerns about an economic slowdown. As the Federal Reserve’s September meeting approaches, the stakes are high, and investors should brace for a potentially turbulent period ahead.
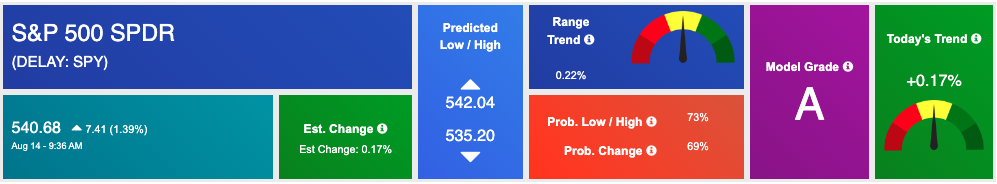
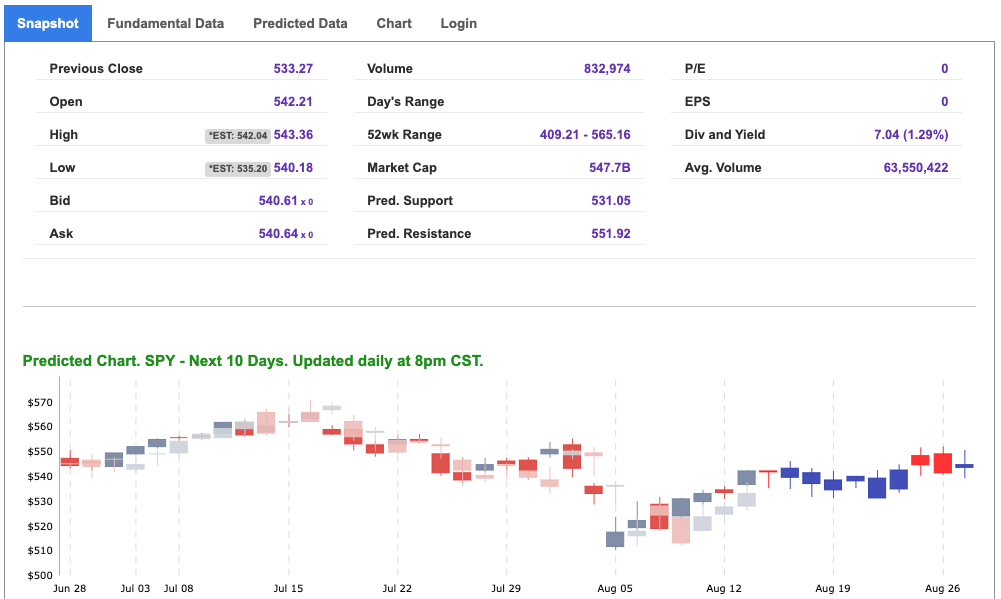
Using the “SPY” symbol to analyze the S&P 500 our 10-day prediction window shows a near-term positive outlook. Prediction data is uploaded after the market closes at 6 p.m. CST. Today’s data is based on market signals from the previous trading session.
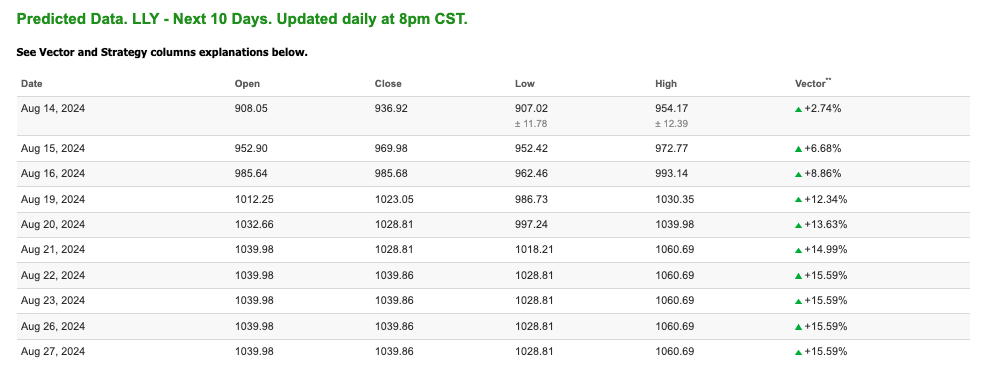
Note: The Vector column calculates the change of the Forecasted Average Price for the next trading session relative to the average of actual prices for the last trading session. The column shows the expected average price movement “Up or Down”, in percent. Trend traders should trade along the predicted direction of the Vector. The higher the value of the Vector the higher its momentum.
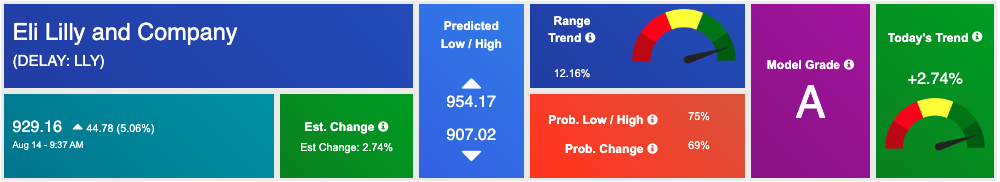
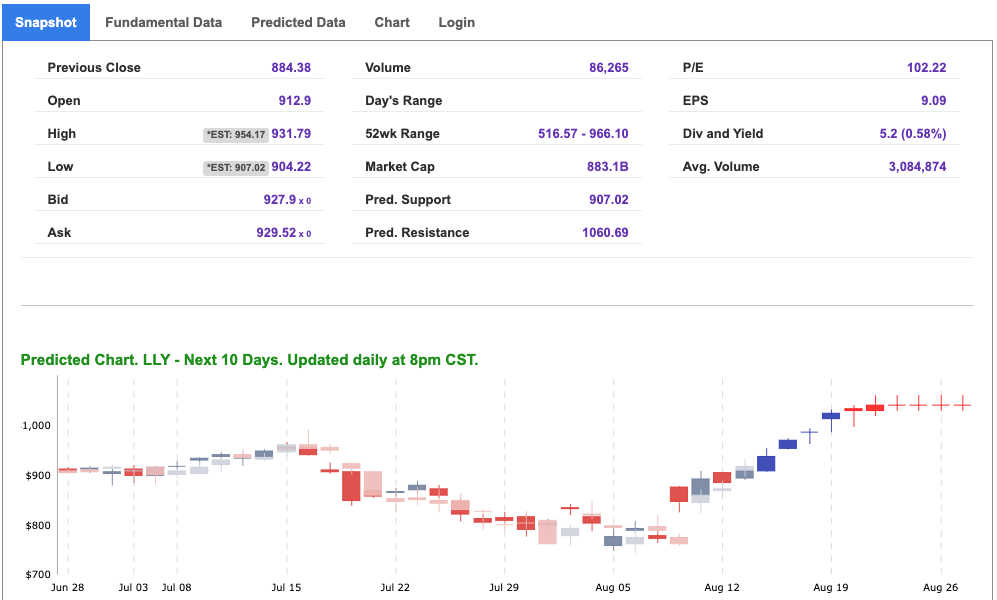
*Please note: At the time of publication Vlad Karpel does have a position in the featured symbol, LLY. Our featured symbol is part of your free subscription service. It is not included in any paid Tradespoon subscription service. Vlad Karpel only trades his money in paid subscription services. If you are a paid subscriber, please review your Premium Member Picks, ActiveTrader, or MonthlyTrader recommendations. If you are interested in receiving Vlad’s picks, please click here.
West Texas Intermediate for Crude Oil delivery (CL.1) is priced at $77.72 per barrel, down 0.79%, at the time of publication.
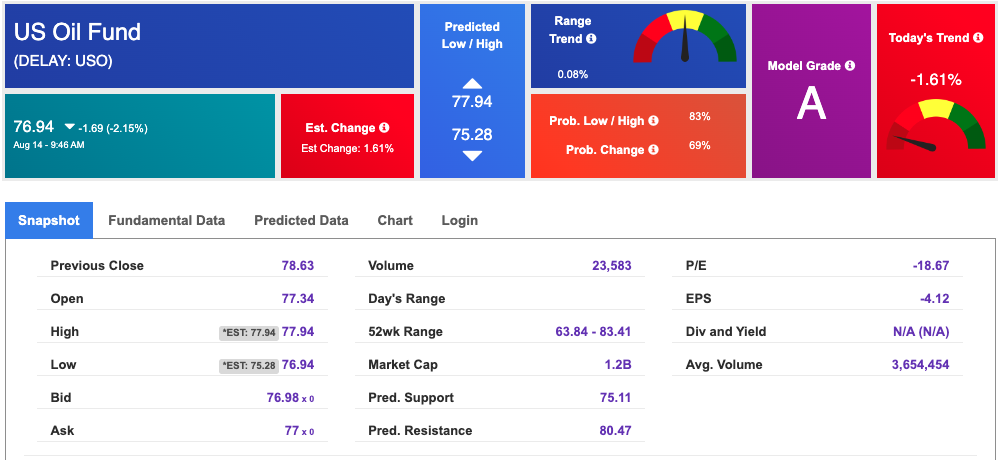
Looking at USO, a crude oil tracker, our 10-day prediction model shows mixed signals. The fund is trading at $76.94 at the time of publication. Prediction data is uploaded after the market close at 6 p.m., CST. Today’s data is based on market signals from the previous trading session.
The price for the Gold Continuous Contract (GC00) is down 0.75% at $2,489.00 at the time of publication.
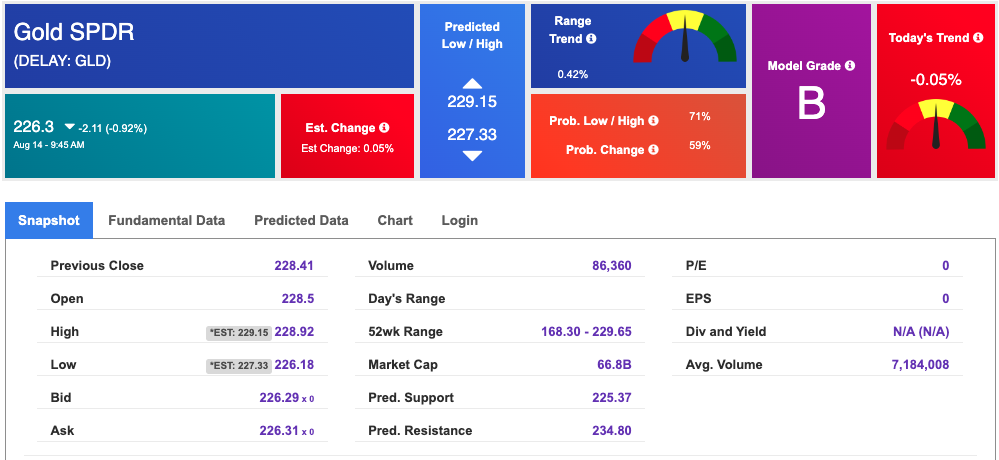
Using SPDR GOLD TRUST (GLD) as a tracker in our Stock Forecast Tool, the 10-day prediction window shows mixed signals. The gold proxy is trading at $226.3 at the time of publication. Vector signals show -0.05% for today. Prediction data is uploaded after the market close at 6 p.m., CST. Today’s data is based on market signals from the previous trading session.
The yield on the 10-year Treasury note is down at 3.828% at the time of publication.
The yield on the 30-year Treasury note is down at 4.125% at the time of publication.
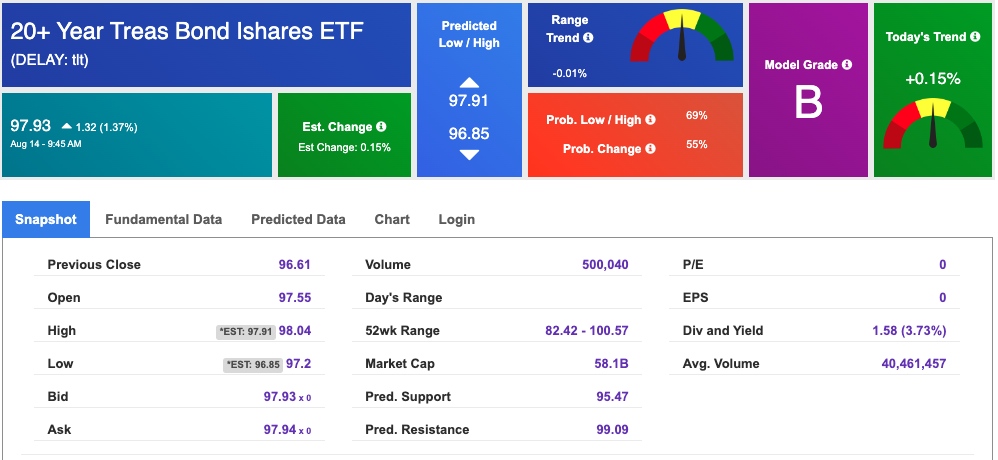
Using the iShares 20+ Year Treasury Bond ETF (TLT) as a proxy for bond prices in our Stock Forecast Tool, we see mixed signals in our 10-day prediction window. Prediction data is uploaded after the market close at 6 p.m., CST. Today’s data is based on market signals from the previous trading session.
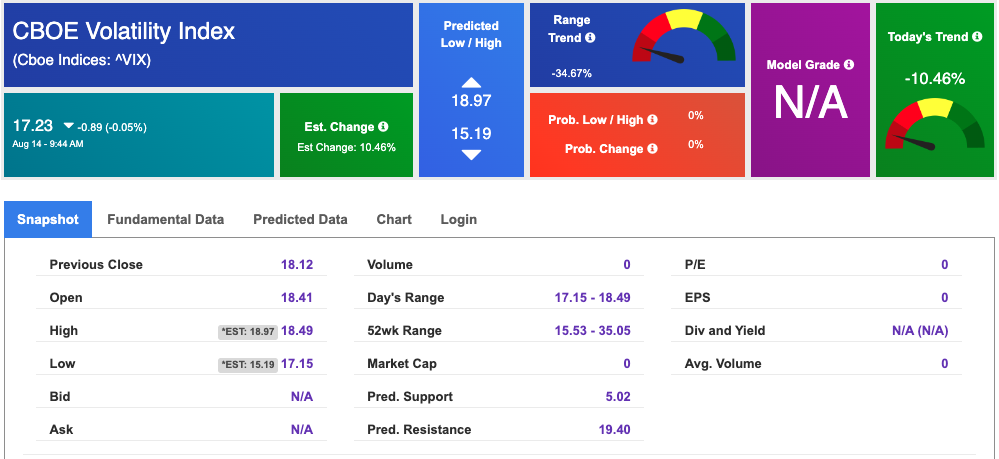
The CBOE Volatility Index (^VIX) is priced at $17.23 down 0.05% at the time of publication, and our 10-day prediction window shows mixed signals. Prediction data is uploaded after the market close at 6 p.m., CST. Today’s data is based on market signals from the previous trading session.
Please share this Tradespoon Market Commentary with your friends.
![]()

![]()
Comments Off on


Tradespoon Tools make finding winning trades in minute as easy as 1-2-3.
Our simple 3 step approach has resulted in an average return of almost 20% per trade!

