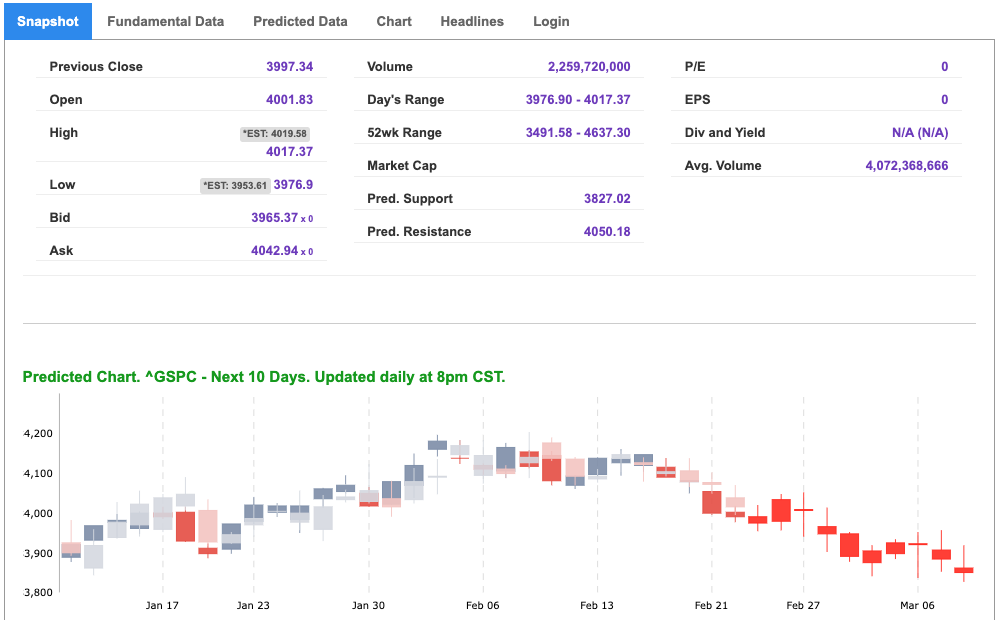
The stock market experienced a mixed day of trading as investors analyzed the minutes from the Federal Reserve’s recent policy meeting, which were made public on Wednesday afternoon. While the Dow and S&P saw a dip in value, the Nasdaq managed to maintain its gains. The newly released Fed minutes revealed that the central bank expects a peak in interest rates sometime later this year. Despite concerns about the oil supply, prices continued to slip due to prevailing anxieties about rising interest rates. Look out for GDP revision data on Thursday, while Friday will feature PCE, Consumer Spending, Personal Income, and New Home Sales. Additionally, several key Fed members are due to speak on Friday.
This week has been a difficult one for the stock market, with indexes experiencing their largest year-to-date declines on Tuesday, following a string of strong economic data. Purchasing Managers’ Indexes, coupled with robust retail sales and labor market reports, have contributed to the narrative that the US economy is resilient, and investors have become increasingly convinced that the Federal Reserve will continue to raise interest rates and keep them higher than initially anticipated. The recently-released minutes from the Federal Open Market Committee’s (FOMC) Jan. 31-Feb. 1 meeting shed further light on the endgame for interest rate hikes, with several officials predicting a slowdown in the federal funds rate as inflation cools. At present, the market has priced in two more 25-basis-point rate hikes for 2023, with a possibility of a third at the June meeting. As investors navigate these uncertain times, it is crucial to monitor economic indicators and Fed policy announcements carefully.
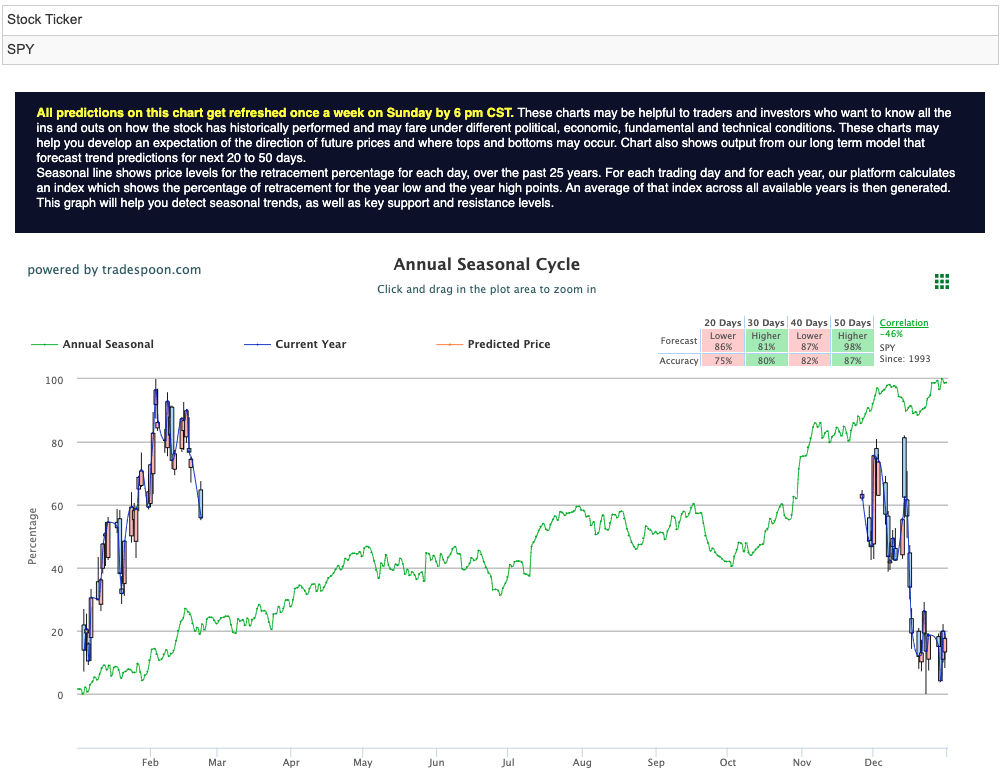
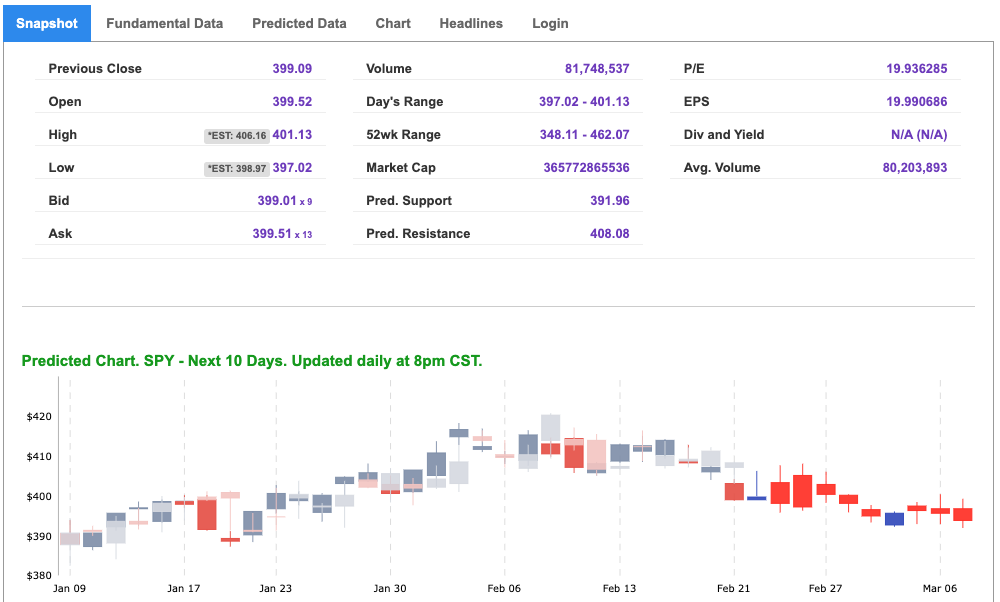
Currently, the $VIX is hovering around the $22 level, with investors keeping a close eye on upcoming earnings reports from major companies like $BABA, $NVDA, and $ETSY, as well as the release of PCE data. The direction of the market could be influenced by these events. As for the SPY, overhead resistance levels are currently at $408 and then $418, while support can be found at $400 and $390. Our analysis indicates that the market is likely to trade within a sideways range for the next 2-8 weeks. As a result, we suggest taking a MARKET NEUTRAL approach at this time and recommend that our subscribers consider hedging their positions. By carefully monitoring the market and taking a strategic approach, investors can navigate these uncertain times and make informed decisions about their portfolios. Market commentary readers should maintain clearly defined stop levels for all positions. For reference, the SPY Seasonal Chart is shown below:


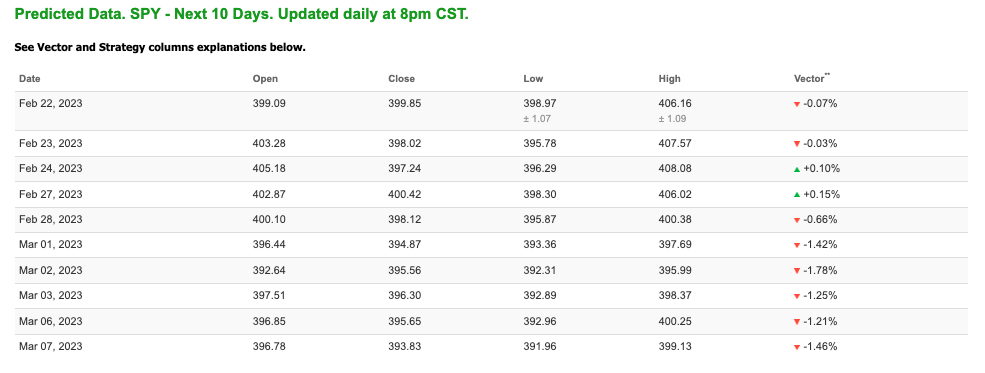
Note: The Vector column calculates the change of the Forecasted Average Price for the next trading session relative to the average of actual prices for the last trading session. The column shows the expected average price movement “Up or Down”, in percent. Trend traders should trade along the predicted direction of the Vector. The higher the value of the Vector the higher its momentum.
*Please note: At the time of publication Vlad Karpel does have a position in the featured symbol, spy. Our featured symbol is part of your free subscription service. It is not included in any paid Tradespoon subscription service. Vlad Karpel only trades his money in paid subscription services. If you are a paid subscriber, please review your Premium Member Picks, ActiveTrader, or MonthlyTrader recommendations. If you are interested in receiving Vlad’s picks, please click here.
West Texas Intermediate for Crude Oil delivery (CL.1) is priced at $73.86 per barrel, down 3.27%, at the time of publication.
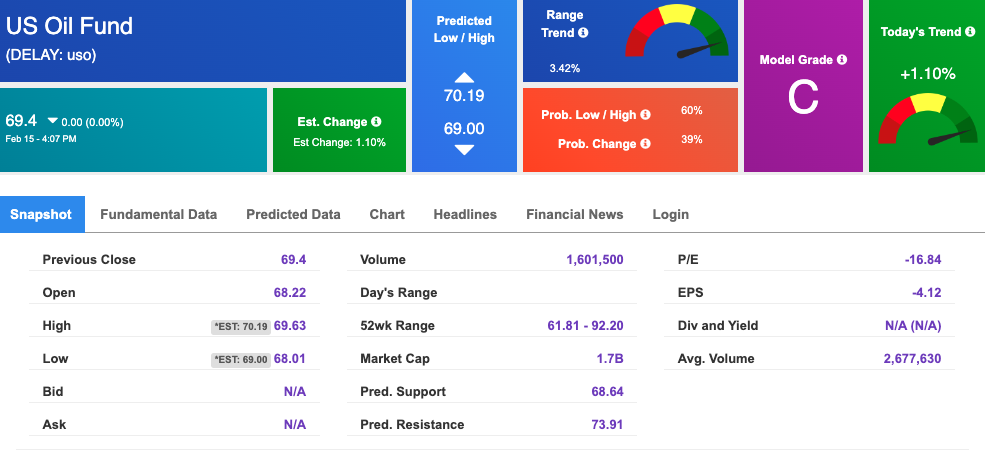
Looking at USO, a crude oil tracker, our 10-day prediction model shows mixed signals. The fund is trading at $69.4 at the time of publication. Prediction data is uploaded after the market close at 6 p.m., CST. Today’s data is based on market signals from the previous trading session.
The price for the Gold Continuous Contract (GC00) is down 0.45% at $1834.20 at the time of publication.
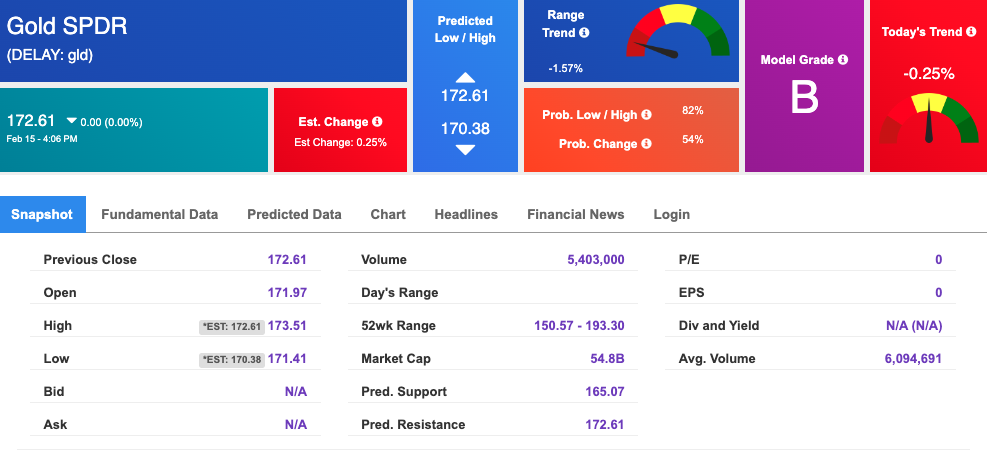
Using SPDR GOLD TRUST (GLD) as a tracker in our Stock Forecast Tool, the 10-day prediction window shows mixed signals. The gold proxy is trading at $172.61 at the time of publication. Vector signals show -0.25% for today. Prediction data is uploaded after the market close at 6 p.m., CST. Today’s data is based on market signals from the previous trading session.
The yield on the 10-year Treasury note is down at 3.925% at the time of publication.
The yield on the 30-year Treasury note is down at 3.916% at the time of publication.
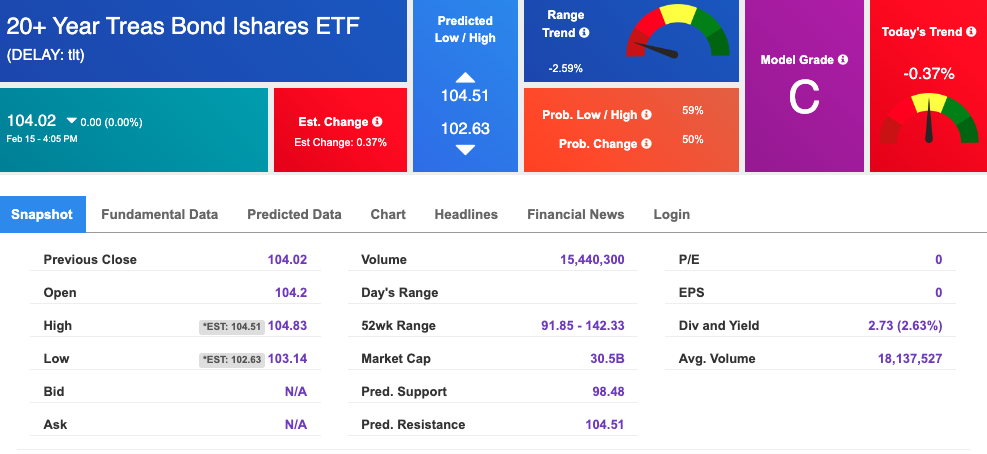
Using the iShares 20+ Year Treasury Bond ETF (TLT) as a proxy for bond prices in our Stock Forecast Tool, we see mixed signals in our 10-day prediction window. Prediction data is uploaded after the market close at 6 p.m., CST. Today’s data is based on market signals from the previous trading session.
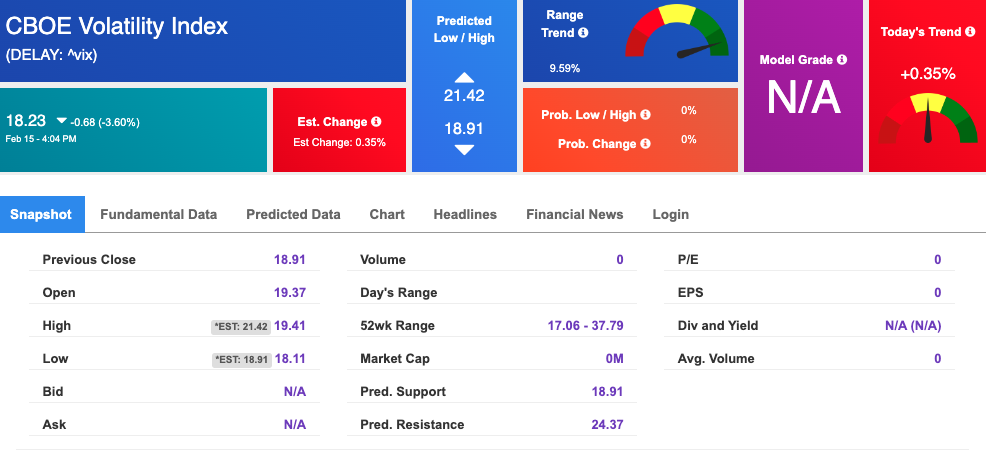
The CBOE Volatility Index (^VIX) is $18.23 at the time of publication, and our 10-day prediction window shows mixed signals. Prediction data is uploaded after the market close at 6 p.m., CST. Today’s data is based on market signals from the previous trading session.
Comments Off on
Tradespoon Tools make finding winning trades in minute as easy as 1-2-3.
Our simple 3 step approach has resulted in an average return of almost 20% per trade!