 Special Offer: Try the 'Premium Membership' for ONLY $37!
CLICK HERE TO LEARN MORE
Special Offer: Try the 'Premium Membership' for ONLY $37!
CLICK HERE TO LEARN MORE
In a mixed day for the stock market, the Dow Jones Industrial Average dropped 115 points, marking a downturn as June begins, while tech stocks managed to eke out gains, buoying both the S&P 500 and Nasdaq. Investors are keenly watching this week’s jobs data and the performance of the technology sector following Nvidia’s new chip plans announcement.
Market Movements and Key Drivers
The Dow Jones experienced a significant midday drop, primarily driven by declines in its top five components. The S&P 500 decreased by 0.6%, and the Nasdaq Composite fell 0.2% after initially trading higher. Tech stocks broke their losing streak, thanks to Nvidia’s unveiling of new artificial intelligence products over the weekend. Nvidia shares surged by 4.9%. Apple also saw a 0.9% increase in its stock price.
Bond Market and Economic Data
Monday also saw a sharp drop in bond yields, with the 10-year Treasury yield experiencing its largest single-day decline since December, closing at 4.401%. This is nearing its 200-day moving average of 4.347%, a critical level that could signal further declines in yields. The drop was triggered by weak U.S. manufacturing data, which suggested a slowing economy and increased expectations for interest rate cuts. The yields on Treasuries, which move inversely to prices, hit session lows as investors absorbed the disappointing manufacturing figures.
Adding to the economic concerns, the Atlanta Federal Reserve’s GDPNow model revised its forecast for second-quarter real GDP growth down to 1.8%, from a previous estimate of 2.7%, citing recent data releases.
Meme Stocks and Energy Market
In a surprising twist, meme stocks saw a resurgence. The Reddit account behind the 2021 GameStop surge posted for the first time since April 2021, causing GameStop stock to skyrocket 102% in early Monday trading before settling at a roughly 80% rise at $41.57. Keith Gill, known as Roaring Kitty on social media, posted a screenshot showing a $181.4 million position in GameStop stock and options.
Meanwhile, crude oil prices plummeted by around 3%. Investors interpreted OPEC+’s decision to extend production cuts while hinting at phasing them out later this year as a sign of imminent oversupply.
Market Outlook
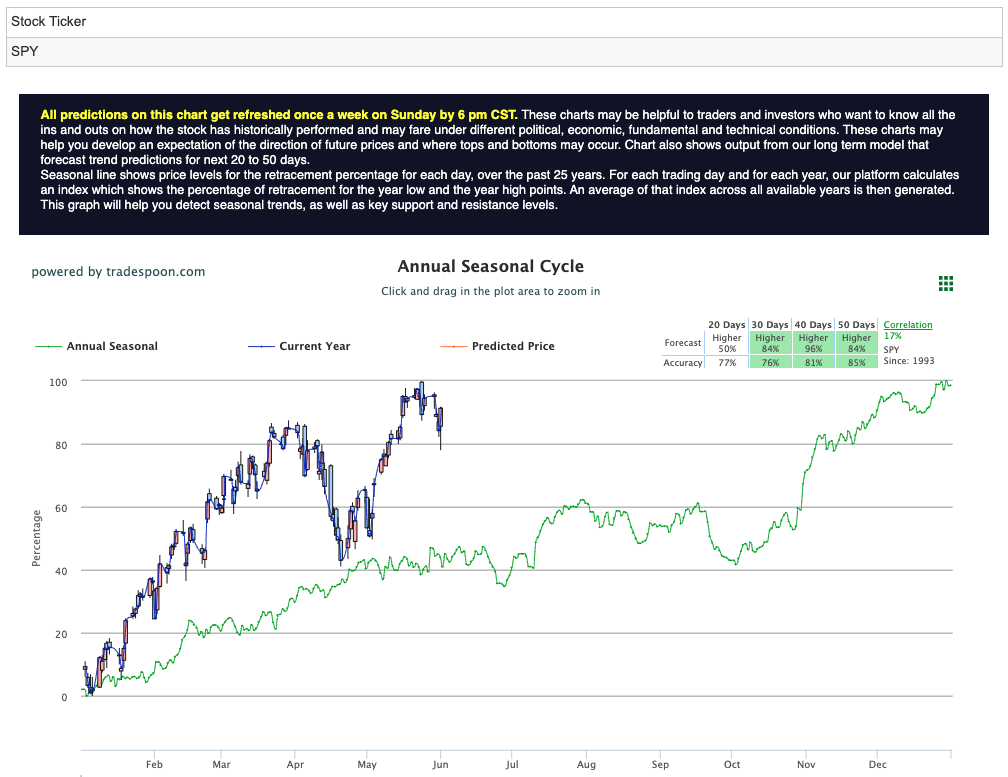
The volatility in Treasury markets reflects the ongoing reassessment of the odds of rate cuts, their timing, magnitude, and frequency. With inflation within expectations and a stronger-than-expected earnings season, market sentiment is shifting. Some analysts have adopted a bullish outlook, anticipating the S&P 500 to reach higher highs and lows, with resistance between $540-$550 and support at $500-$510. For reference, the SPY Seasonal Chart is shown below:
Monday’s mixed market results underscore the current economic uncertainty. While tech stocks show resilience, broader economic indicators suggest caution. Investors will be closely monitoring upcoming jobs data and developments in the technology sector to gauge future market directions.
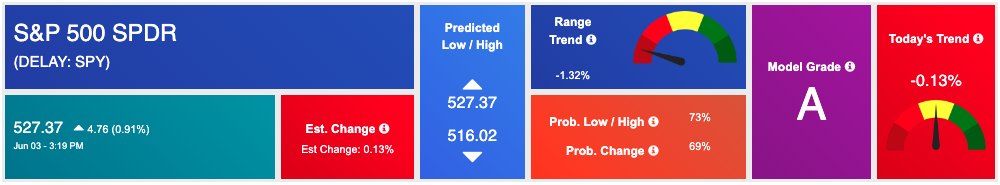
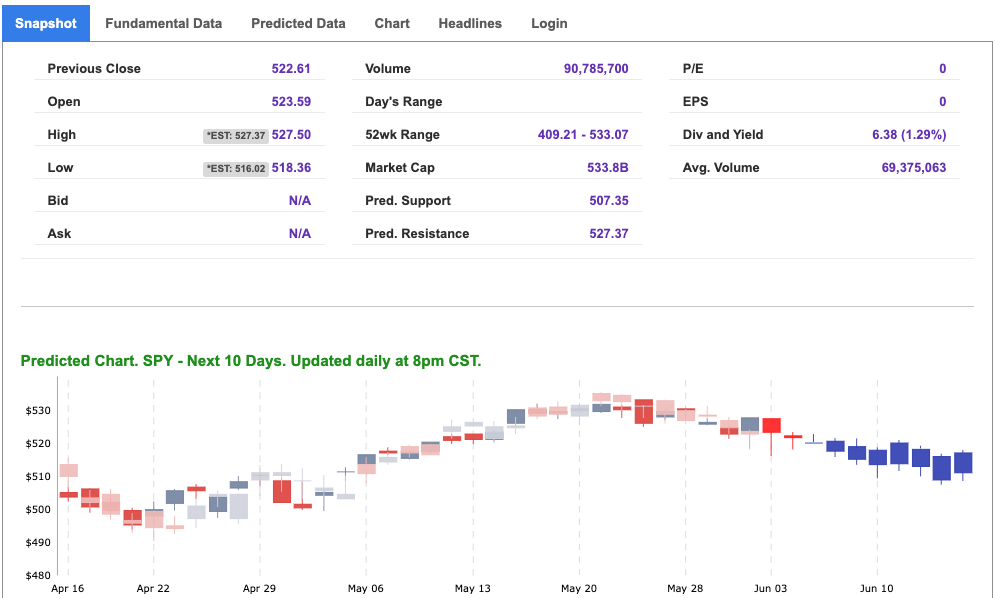
Using the “SPY” symbol to analyze the S&P 500 our 10-day prediction window shows a near-term positive outlook. Prediction data is uploaded after the market closes at 6 p.m. CST. Today’s data is based on market signals from the previous trading session.
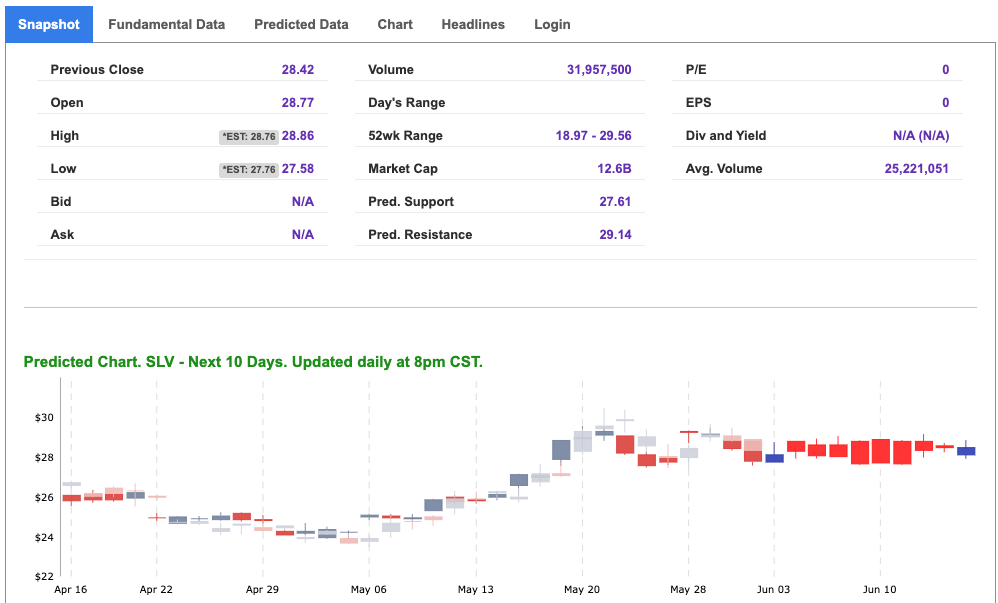
Note: The Vector column calculates the change of the Forecasted Average Price for the next trading session relative to the average of actual prices for the last trading session. The column shows the expected average price movement “Up or Down”, in percent. Trend traders should trade along the predicted direction of the Vector. The higher the value of the Vector the higher its momentum.
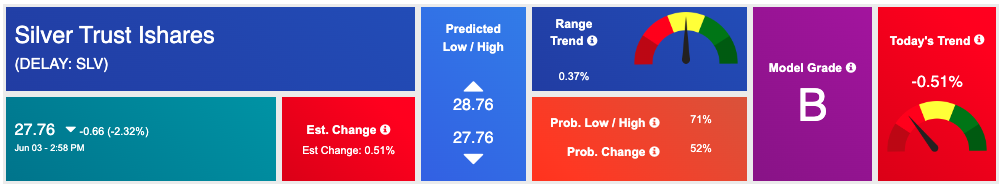
*Please note: At the time of publication Vlad Karpel does have a position in the featured symbol, SLV. Our featured symbol is part of your free subscription service. It is not included in any paid Tradespoon subscription service. Vlad Karpel only trades his money in paid subscription services. If you are a paid subscriber, please review your Premium Member Picks, ActiveTrader, or MonthlyTrader recommendations. If you are interested in receiving Vlad’s picks, please click here.
West Texas Intermediate for Crude Oil delivery (CL.1) is priced at $74.13 per barrel, down 3.71%, at the time of publication.
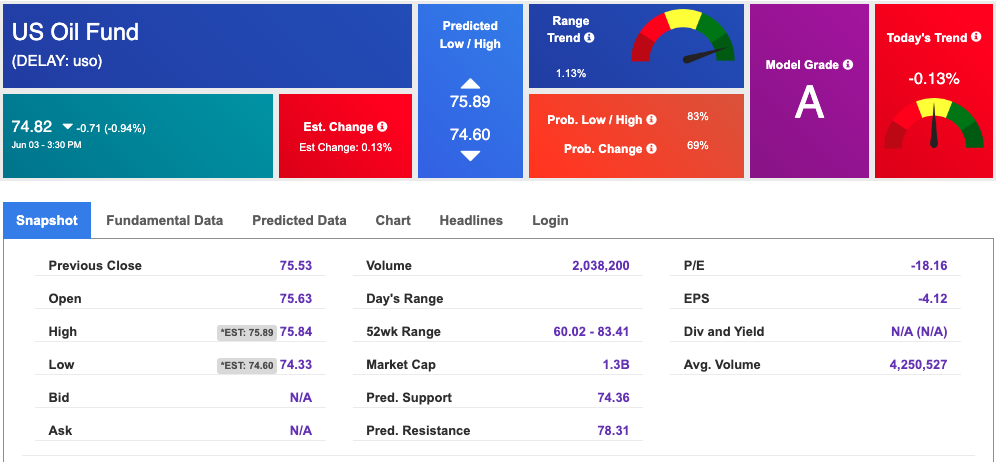
Looking at USO, a crude oil tracker, our 10-day prediction model shows mixed signals. The fund is trading at $74.82 at the time of publication. Prediction data is uploaded after the market close at 6 p.m., CST. Today’s data is based on market signals from the previous trading session.
The price for the Gold Continuous Contract (GC00) is up 1.02% at $2369.70 at the time of publication.
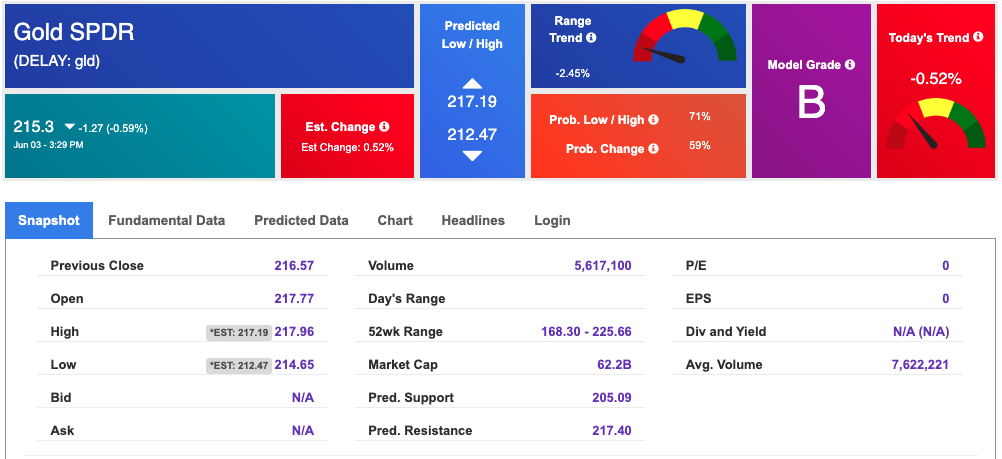
Using SPDR GOLD TRUST (GLD) as a tracker in our Stock Forecast Tool, the 10-day prediction window shows mixed signals. The gold proxy is trading at $215.3 at the time of publication. Vector signals show -0.52% for today. Prediction data is uploaded after the market close at 6 p.m., CST. Today’s data is based on market signals from the previous trading session.
The yield on the 10-year Treasury note is down at 4.395% at the time of publication.
The yield on the 30-year Treasury note is down at 4.541% at the time of publication.
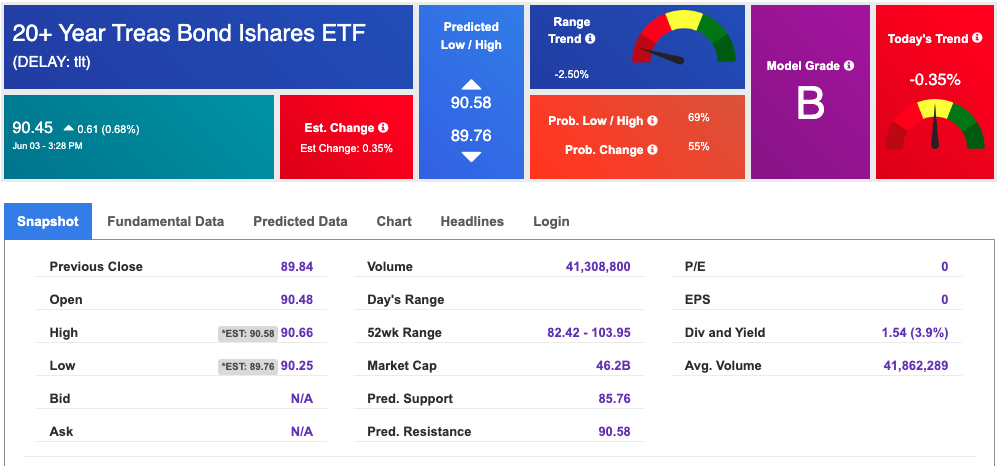
Using the iShares 20+ Year Treasury Bond ETF (TLT) as a proxy for bond prices in our Stock Forecast Tool, we see mixed signals in our 10-day prediction window. Prediction data is uploaded after the market close at 6 p.m., CST. Today’s data is based on market signals from the previous trading session.
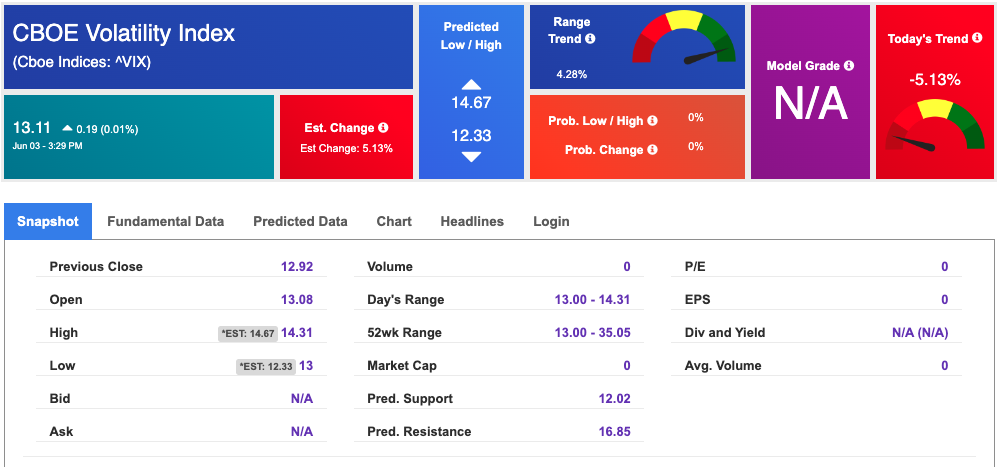
The CBOE Volatility Index (^VIX) is priced at $13.11 up 0.01% at the time of publication, and our 10-day prediction window shows mixed signals. Prediction data is uploaded after the market close at 6 p.m., CST. Today’s data is based on market signals from the previous trading session.
Please share this Tradespoon Market Commentary with your friends.
![]()

![]()
Comments Off on


Tradespoon Tools make finding winning trades in minute as easy as 1-2-3.
Our simple 3 step approach has resulted in an average return of almost 20% per trade!

