 Special Offer: Try the 'Vlad's Portfolio Membership' for ONLY $37!
CLICK HERE TO LEARN MORE
Special Offer: Try the 'Vlad's Portfolio Membership' for ONLY $37!
CLICK HERE TO LEARN MORE
Stock Market Update: Dow Plunges as Tariffs and Economic Uncertainty Weigh on Investors
Wall Street faced a sharp sell-off on Monday as escalating trade tensions and weaker-than-expected economic data rattled investor sentiment. The Dow Jones Industrial Average tumbled more than 900 points after President Donald Trump confirmed that a 25% tariff on imports from Canada and Mexico would take effect on Tuesday. The S&P 500 and Nasdaq also sank, as markets struggled to digest the implications of heightened trade barriers.
The market initially opened higher, with a broad rally lifting most sectors. However, as the trading session progressed, gains evaporated, and selling pressure intensified. By midday, fewer than half of the S&P 500 components were in positive territory, while two-thirds of the Dow’s 30 stocks were in the red.
Economic Data Fuels Market Uncertainty
Investor concerns deepened following the latest report from the Institute for Supply Management (ISM), which showed that U.S. manufacturing activity weakened more than expected in February. The decline in the ISM Manufacturing PMI signaled a slowdown in factory activity, reinforcing fears that trade tensions and persistent inflationary pressures are weighing on economic growth.
Adding to the cautionary tone, recent consumer sentiment surveys indicated heightened worries about rising prices, despite inflation showing signs of moderation in some areas. These developments suggest that while inflation may be cooling, economic uncertainty remains a key headwind for markets.
A Volatile Start to March Following a Turbulent February
Last week, markets navigated a roller-coaster ride as investors balanced shifting Federal Reserve expectations, mixed economic data, and evolving global trade dynamics. The S&P 500 remained locked in a consolidation phase, trading within a well-defined range. Resistance has been firmly established between 620 and 640, while short-term support is holding in the 560–580 zone. For reference, the SPY Seasonal Chart is shown below:
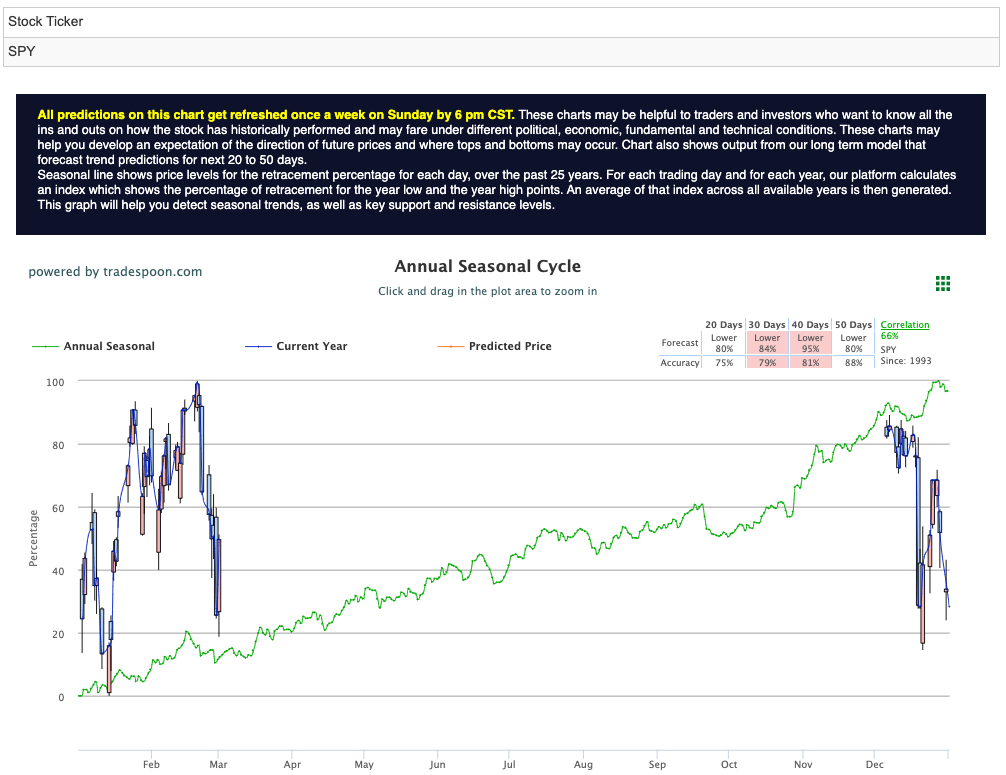
While these levels suggest the market has not entered a full-fledged downtrend, the combination of elevated interest rates and ongoing policy uncertainty continues to cap upside momentum.
Key Events to Watch This Week
With inflation cooling but labor markets remaining strong, investors are bracing for a busy week of economic reports, Federal Reserve commentary, and corporate earnings. The week of March 3–7 is packed with data releases that could significantly influence market sentiment and shape expectations for future Fed policy moves.
Monday-Tuesday:
Midweek Highlights:
Thursday-Friday:
Federal Reserve in Focus
Several Federal Reserve officials will be speaking throughout the week, with Chair Powell’s remarks on Friday being the most closely watched. Investors will be analyzing his comments for any shifts in the Fed’s stance on inflation and interest rates, particularly in response to key economic reports. Other notable Fed speakers include New York Fed President John Williams, Fed Governor Christopher Waller, and Atlanta Fed President Raphael Bostic.
Market Outlook: Volatility Likely to Persist
With labor data, Fed commentary, and earnings reports dominating the week, volatility is expected to remain elevated. Investors will closely monitor any signals of economic slowdown or further cooling inflation, as these factors could influence the Fed’s next policy decisions. In this uncertain environment, a disciplined, data-driven approach will be essential for navigating the evolving market landscape.
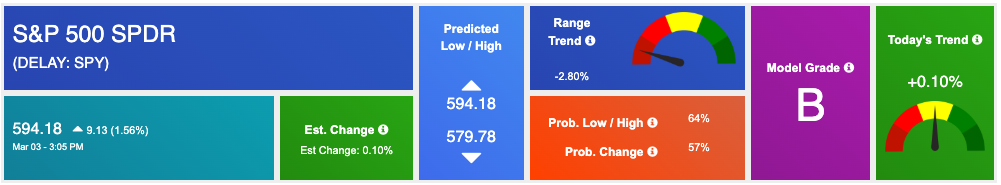
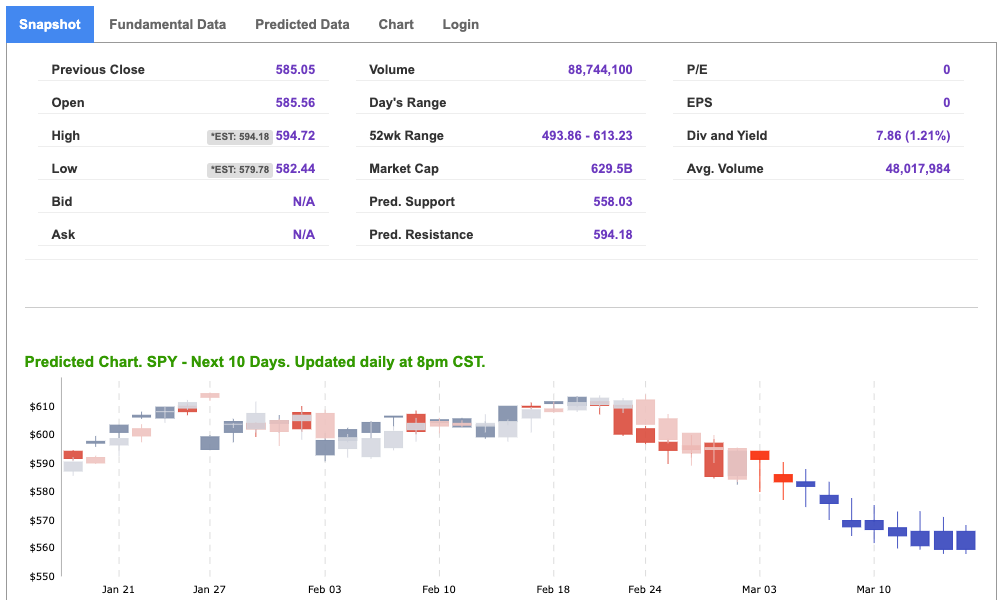
Using the “SPY” symbol to analyze the S&P 500 our 10-day prediction window shows a near-term positive outlook. Prediction data is uploaded after the market closes at 6 p.m. CST. Today’s data is based on market signals from the previous trading session.
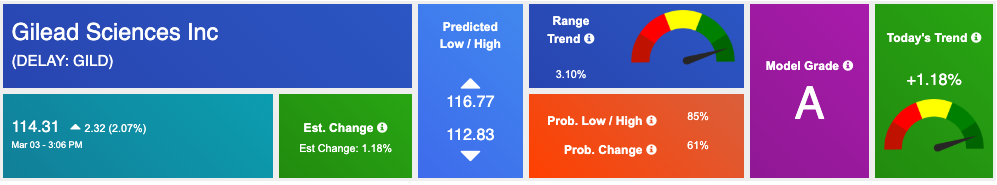
Our featured symbol for Tuesday is GILD. Gilead Sciences Inc. – GILD is showing a steady vector in our Stock Forecast Toolbox’s 10-day forecast.
The symbol is trading at $114.31 with a vector of +1.18% at the time of publication.
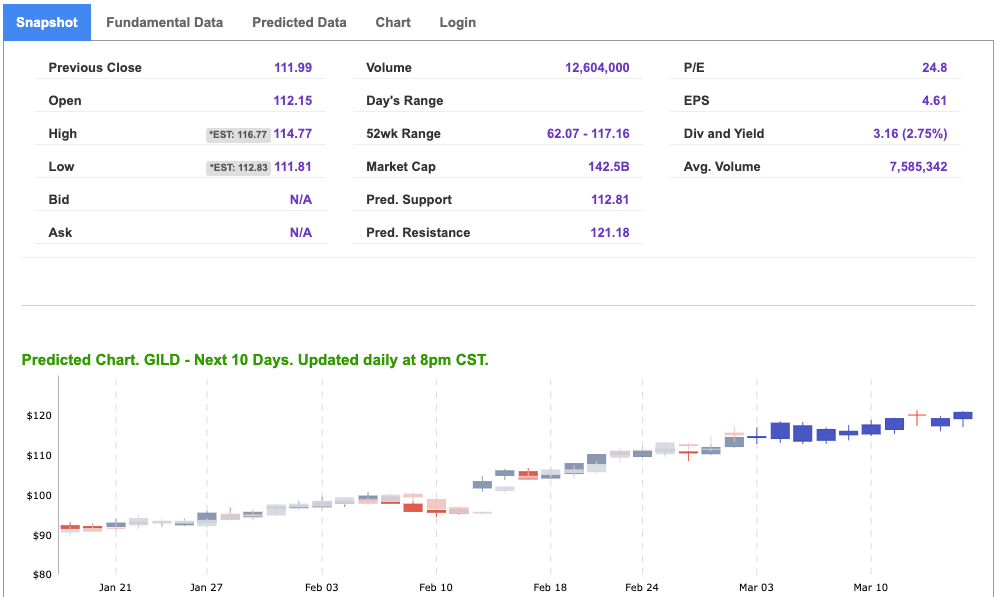
10-Day Prediction data is uploaded after the market close at 6 p.m., CST. Today’s data is based on market signals from the previous trading session.
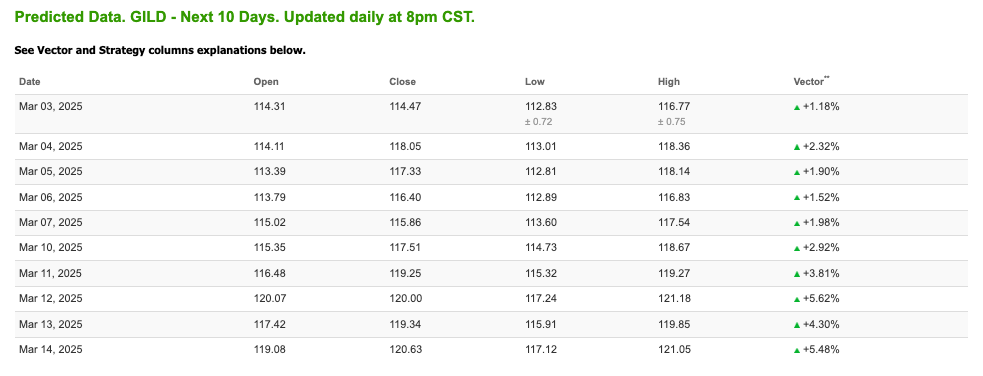
Note: The Vector column calculates the change of the Forecasted Average Price for the next trading session relative to the average of actual prices for the last trading session. The column shows the expected average price movement “Up or Down”, in percent. Trend traders should trade along the predicted direction of the Vector. The higher the value of the Vector the higher its momentum.
*Please note: At the time of publication Vlad Karpel does have a position in the featured symbol, GILD. Our featured symbol is part of your free subscription service. It is not included in any paid Tradespoon subscription service. Vlad Karpel only trades his money in paid subscription services. If you are a paid subscriber, please review your Premium Member Picks, ActiveTrader, or MonthlyTrader recommendations. If you are interested in receiving Vlad’s picks, please click here.
West Texas Intermediate for Crude Oil delivery (CL.1) is priced at $68.33 per barrel, down 2.05%, at the time of publication.
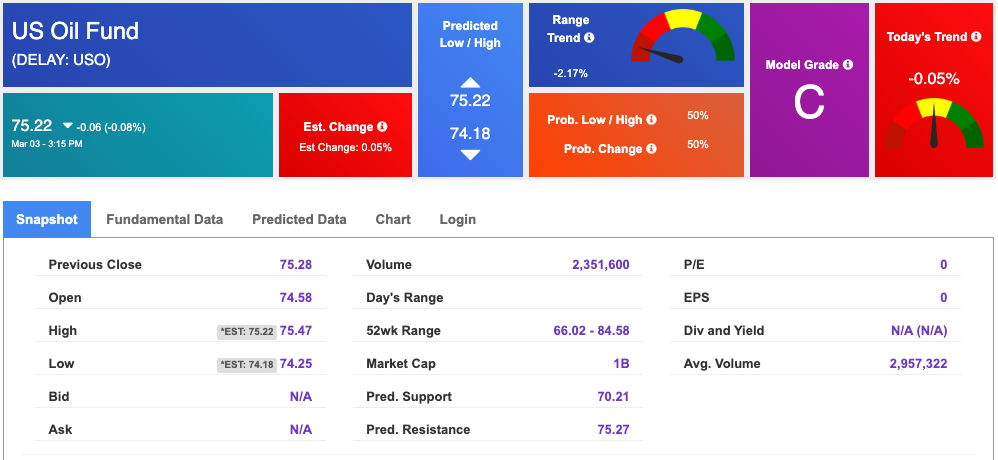
Looking at USO, a crude oil tracker, our 10-day prediction model shows mixed signals. The fund is trading at $75.22 at the time of publication. Prediction data is uploaded after the market close at 6 p.m., CST. Today’s data is based on market signals from the previous trading session.
The price for the Gold Continuous Contract (GC00) is up 1.90% at $2,902.50 at the time of publication.
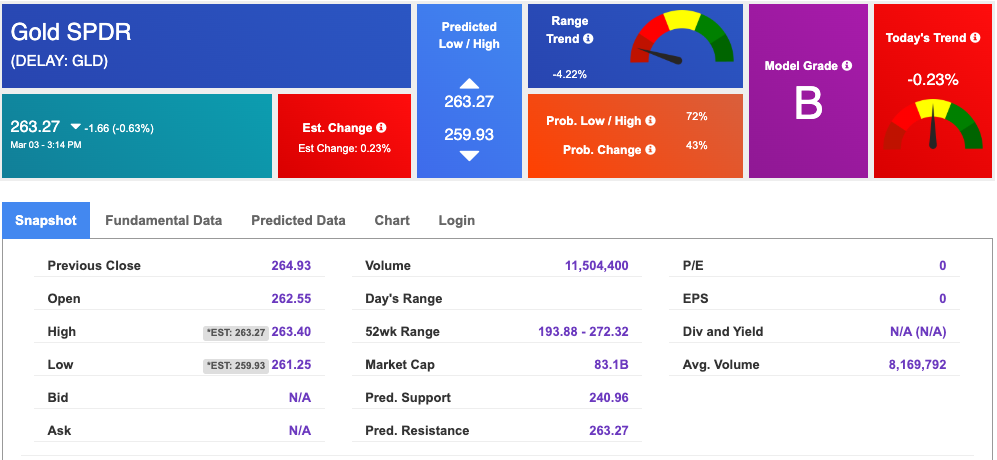
Using SPDR GOLD TRUST (GLD) as a tracker in our Stock Forecast Tool, the 10-day prediction window shows mixed signals. The gold proxy is trading at $263.27 at the time of publication. Vector signals show -0.23% for today. Prediction data is uploaded after the market close at 6 p.m., CST. Today’s data is based on market signals from the previous trading session.
The yield on the 10-year Treasury note is down at 4.163% at the time of publication.
The yield on the 30-year Treasury note is down at 4.454% at the time of publication.
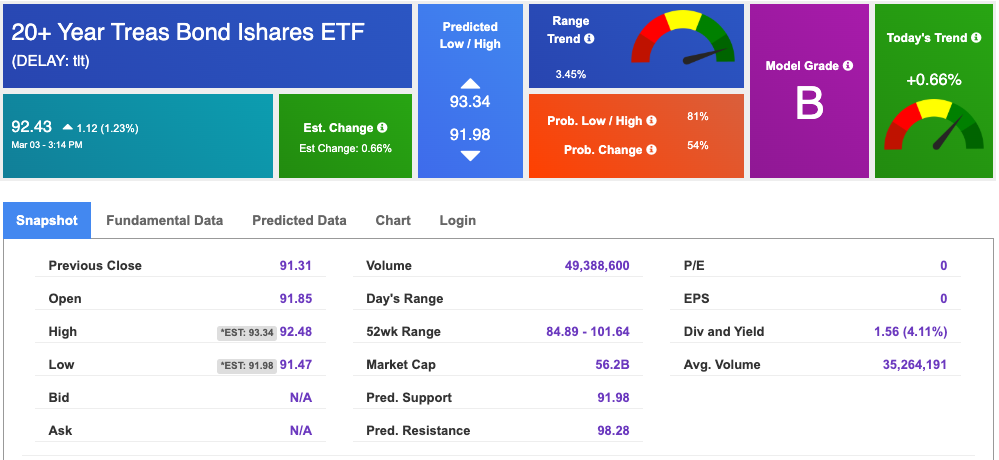
Using the iShares 20+ Year Treasury Bond ETF (TLT) as a proxy for bond prices in our Stock Forecast Tool, we see mixed signals in our 10-day prediction window. Prediction data is uploaded after the market close at 6 p.m., CST. Today’s data is based on market signals from the previous trading session.
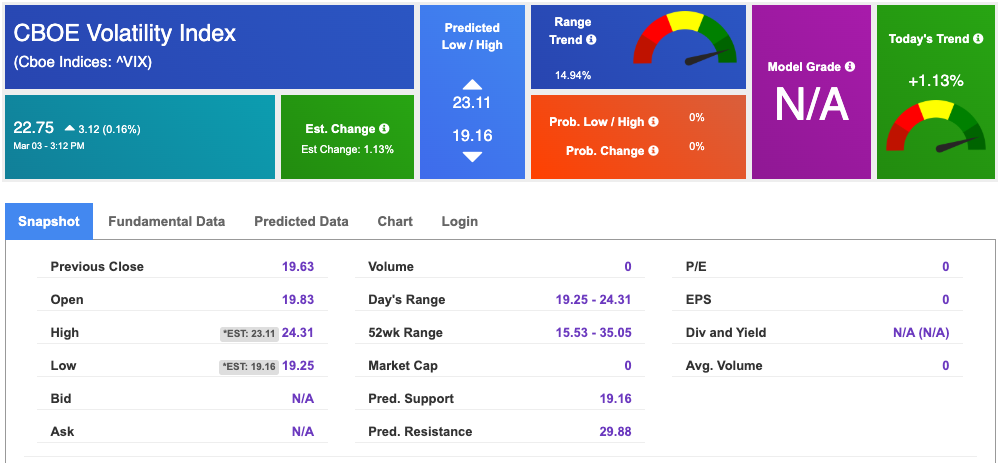
The CBOE Volatility Index (^VIX) is priced at $22.75 up 0.16% at the time of publication, and our 10-day prediction window shows mixed signals. Prediction data is uploaded after the market close at 6 p.m., CST. Today’s data is based on market signals from the previous trading session.
Please share this Tradespoon Market Commentary with your friends.
![]()

![]()
Comments Off on


Tradespoon Tools make finding winning trades in minute as easy as 1-2-3.
Our simple 3 step approach has resulted in an average return of almost 20% per trade!

