RoboStreet – September 29, 2022
Ahead of Earnings Markets Find Bottom
U.S. Stocks saw a back and forth week that appeared to have developed its bottom following the latest Federal Reserve policy update. On Wednesday, shares were able to rebound after hitting multi-month lows with back to back losing sessions to open the week. The rebound was short lived as shares continued lower on Thursday. Specifically, during the afternoon on Thursday, stocks in the United States fell sharply after a batch of mixed economic indicators were released, which emphasized the Federal Reserve’s likelihood to quickly raise interest rates in order to undermine inflation.
Likewise, global policy updates have dominated market discourse with two developing updates from Japan and England. On Wednesday, the Bank of England announced it would buy an unlimited amount of bonds in an effort to restore “orderly market conditions,” which immediately sent yields lower. Initially, the Bank of England’s decision to resume its bond-buying program in an effort to stabilize the country’s bond market caused global yields to pull back, giving stocks a boost on Wednesday.
And remember we’re not talking about day-trading here. I’m looking for 50-100% gains within the next 3 months, so my weekly updates are timely enough for you to act.
In addition, the Bank of Japan stated this week that it will buy Japanese government bonds through a special operation. The yield on benchmark 10-year bonds reached 0.25%, which is the policy barrier, as global rates surge and the bank tries to keep up. The BOJ plans to buy debt with ten- to twenty-five-year terms and securities with five- to ten-year durations, worth 250 billion yen in total. The Japanese bond market was under strain amid an unprecedented rise in global interest rates, as major central banks including the United States’ Federal Reserve and the European Central Bank raced to raise rates to cool overheated inflation.
As this occurred, the dollar hit a 20-year high which reinforced the notion of a market pullback while also identifying a strong bottom. It appears inflation will remain prolonged and short-term U.S. yields have spiked, trading near the 4% mark. While they have somewhat ease since this week’s high, as long as they remain above 3.5% there is potential for continued pressure throughout the market.
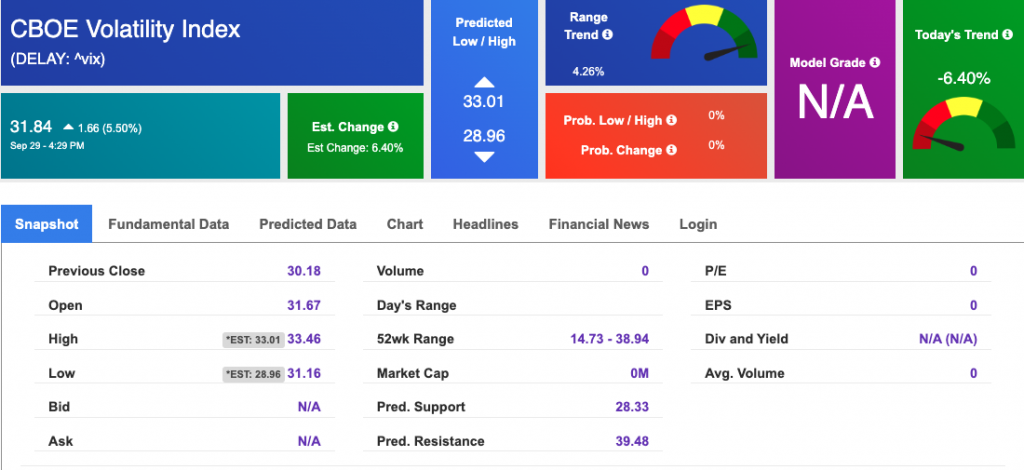
The $VIX is trading near the $31 level, off its $33 high from earlier this week. The upcoming season will play a key factor in the next move in the market. While moving higher on Wednesday, the SPY sold off on Thursday and remains on track to close the week in the red. See $SPY Seasonal Chart below:
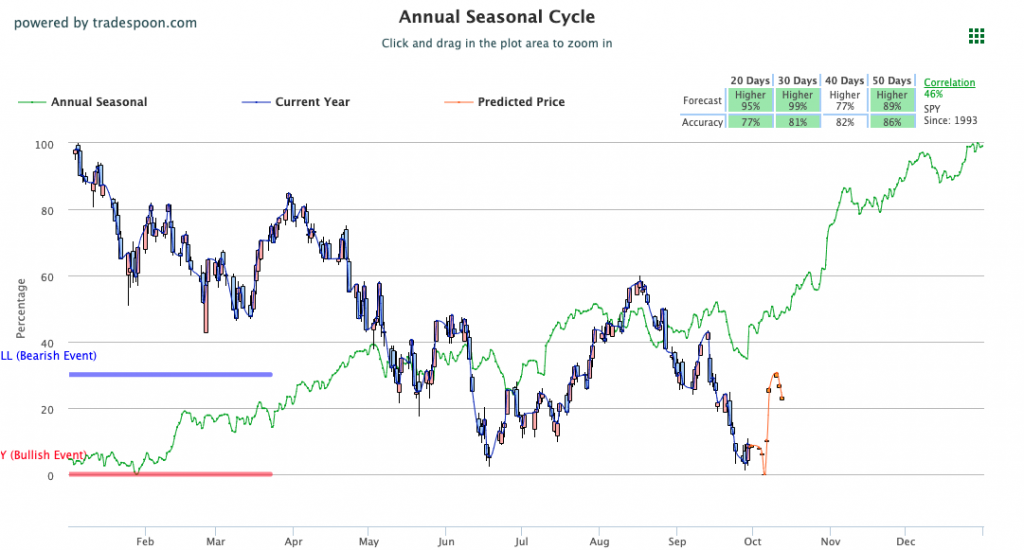
I am watching the overhead resistance levels in the SPY, which are presently at $376 and then $390. The $SPY support is at $360 and then $350. The stock market is currently oversold, and it may stage a multi-week rally.
With the above levels in mind, I will be watching a particular sector as a potential buy through any upcoming volatility. Tech remains an indicator of market-wide trends and we’ve already seen weakness in that sector.
Apple led Thursday’s selloff and contributed heavily to the Nasdaq’s decline, with shares falling 4.9% as sentiment around the company shifted. The latest company beat has demand trends worsening heading into the new fiscal year.
As the oversold nature of the market and latest levels of the dollar have me keen on banking off any potential rallies, I will be looking at different sectors to profit from any potential relief bounces.
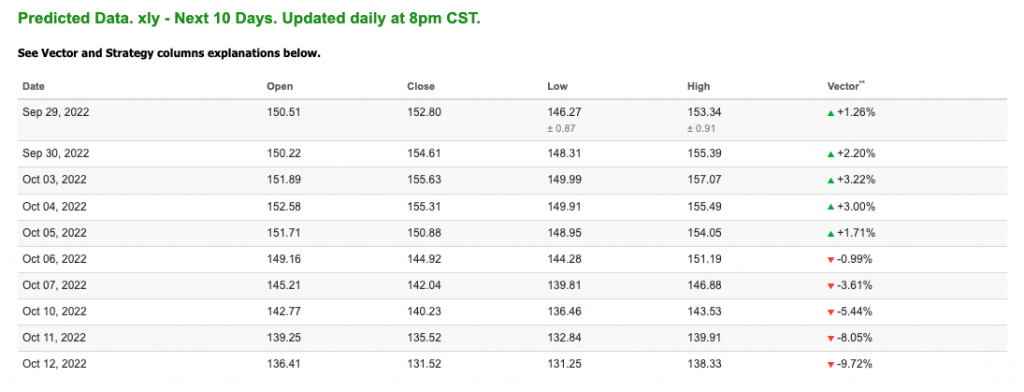
Consumer Discretionary Select Sector SPDR (XLY) is one of the key consumer ETFs with over $15 million assets managed. The fund features retail, auto, consumer services, and the like. On Thursday XLY sold off, along with the rest of the market, and closed near $145. The fund’s 52-week high topped $215 and provides us plenty of room to the upside.

Using the Stock Forecast Toolbox, $XLY is signaling a continuous trend upward early in its 10-day forecast. The trend could be supported, and prolonged, depending on the movement we see in the market next week, but there is a strong signal towards the upside going as high as $155.
Considering the strength I see in the consumer field, it would be wise to find a leader in the field to spearhead the move higher. Both I, and my A.I. arsenal, have identified a symbol that fits the bill. This symbol sold off on Thursday but I am seeing strength and my A.I. tools are in agreement.

Another great opportunity going into October, during the current oversold period of the market, is Tesla Inc. (TSLA), the automotive and clean energy giant.
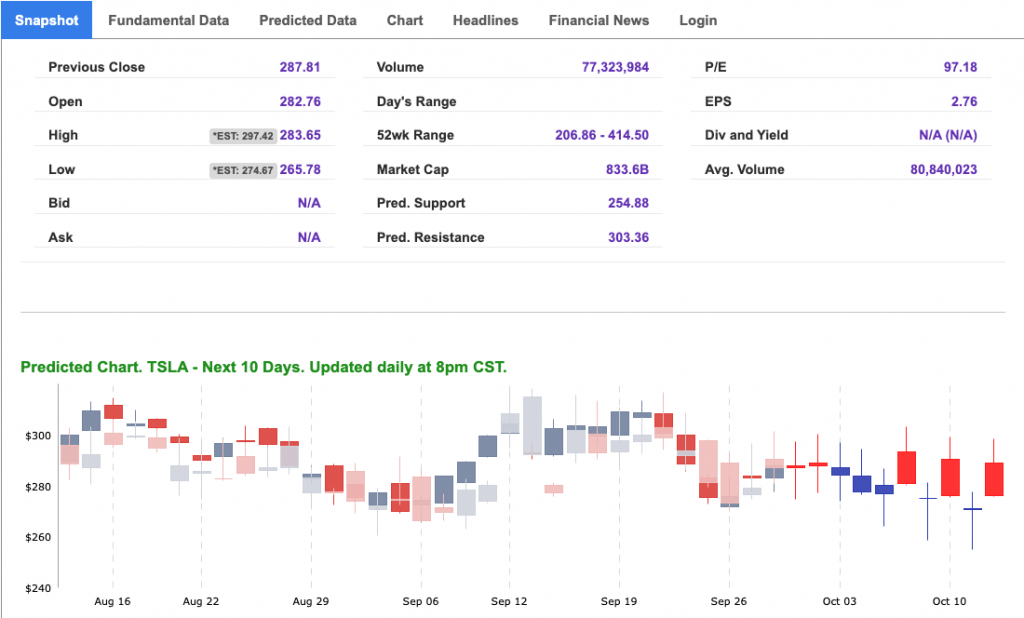
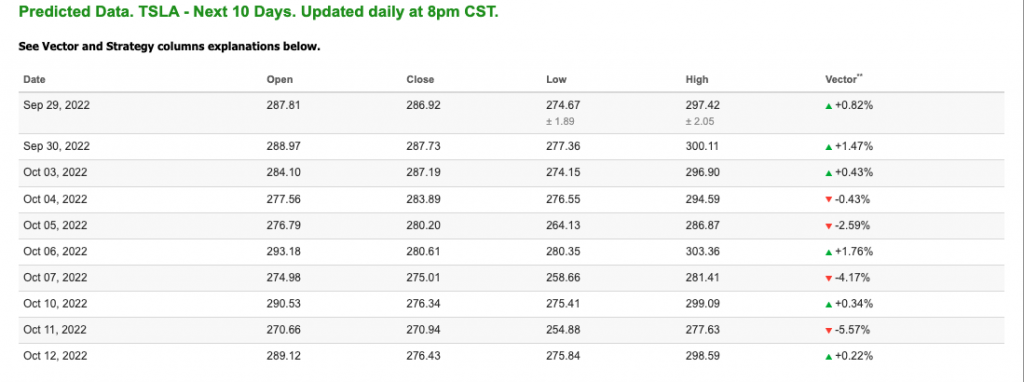
Using the Stock Forecast Toolbox, TSLA is signaling an early trend upward in its 10-day forecast. The symbol is trading below its 52-week and monthly highs and has big potential for the upside. TSLA traded at $380 in April and is currently in the $260-$270 range. The oversold nature of the market makes this symbol path of least resistance up.
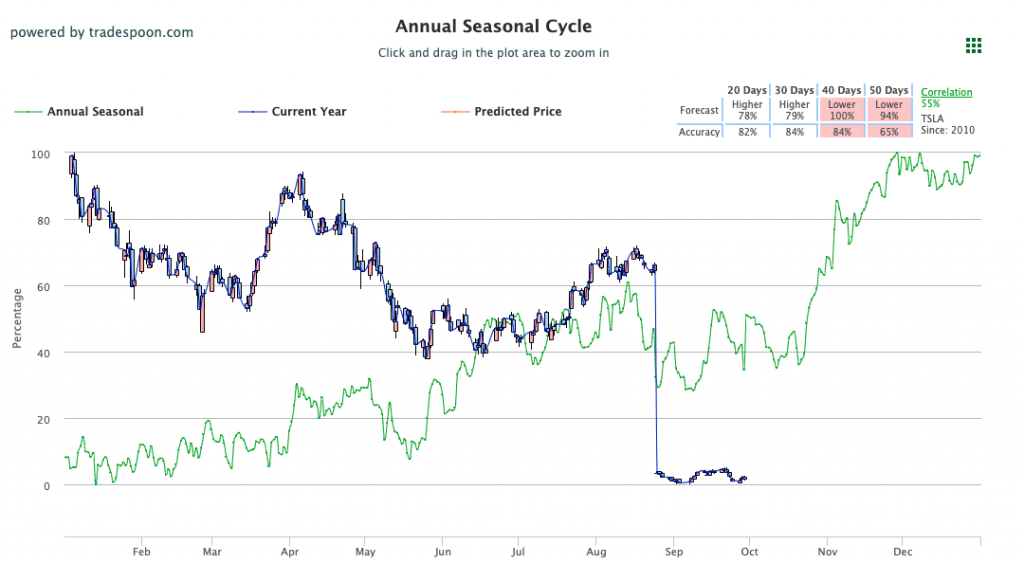
Reviewing the $TSLA Seasonal Chart, we see that there is a big gap between the annual season price, marked in green, and the current year price, marked in blue. The symbol is showing potential to go higher in the next 20 and 30-day ranges with a decently high forecast percentage. This forecast is similar to the one we saw in the Stock Forecast Toolbox, which only adds to my confidence in the symbol. See $TSLA Seasonal Chart below:
This is what the power of AI can do for us, as well as for members of our RoboInvestor stock and ETF advisory service. Our proprietary AI platform identifies trades with a high probability of profits and cuts out all the noise and emotion that typically drives investor behavior.
We email subscribers an online newsletter every other week, over the weekend, that includes my fundamental commentary on the market landscape, a technical read on near-term market direction, an update on current positions, and one or two new recommendations to act on when the market opens Monday.
RoboInvesetor is an unrestricted investment service, in that I may recommend blue-chip stocks or ETFs that represent the major indexes, market sectors, sub-sectors, commodities, currencies, interest rates, volatility, and shorting opportunities through the use of inverse ETFs. Our model portfolio will hold between 12 and 25 positions, depending on market conditions. Lately, we’ve been entirely more cautious with a smaller number of stocks and ETFs.
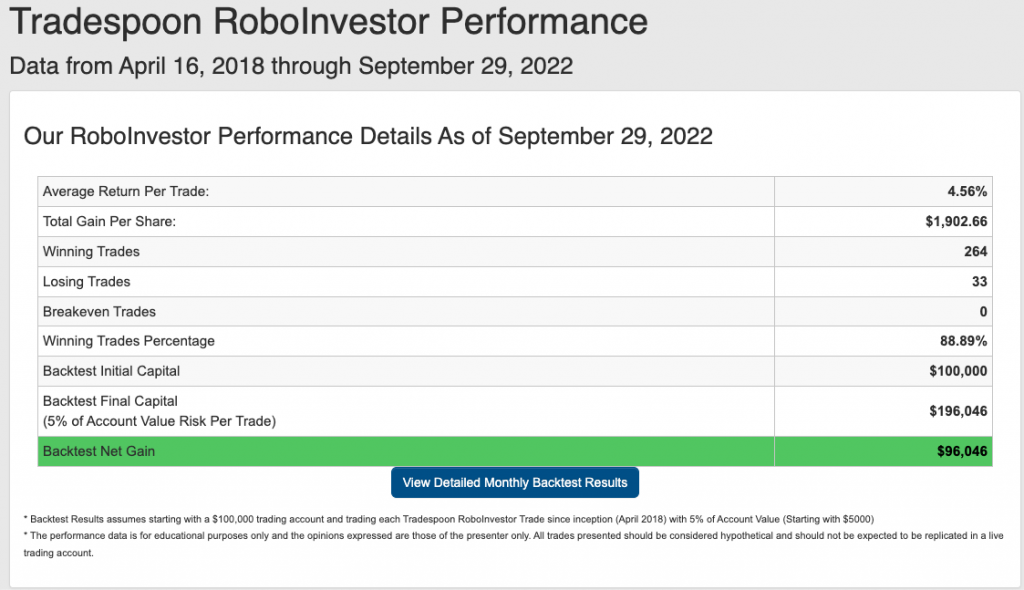
Our track record is one of the very best in the retail advisory industry, where our Winning Trades Percentage is at 88.89% going back to April 2018.
The market continues to shape up to be as unpredictable as I’ve seen since the pandemic broke out in early 2020 – and we still have 3 months to go! Inflation, Fed decisions, geopolitical tension, and the Ukraine war – all factor into how money is being made and lost. Don’t go at it alone in this investing landscape, but instead, put RoboInvestor to work today and add a big layer of confidence to your portfolio going into tomorrow. We’ll be with you every step of the way!
And remember we’re not talking about day-trading here. I’m looking for 50-100% gains within the next 3 months, so my weekly updates are timely enough for you to act.
*Please note: RoboStreet is part of your free subscription service. It is not included in any paid Tradespoon subscription service. Vlad Karpel only trades his own personal money in paid subscription services. If you are a paid subscriber, please review your Premium Member Picks, ActiveTrader, MonthlyTrader, or RoboInvestor recommendations. If you are interested in receiving Vlad’s personal picks, please click here.
Comments Off on
Tradespoon Tools make finding winning trades in minute as easy as 1-2-3.
Our simple 3 step approach has resulted in an average return of almost 20% per trade!