 Special Offer: Try the 'RoboInvestor Membership' for ONLY $37!
CLICK HERE TO LEARN MORE
Special Offer: Try the 'RoboInvestor Membership' for ONLY $37!
CLICK HERE TO LEARN MORE
Stocks opened mixed on Monday after the S&P 500 and Nasdaq closed last week at record highs. Early U.S. stock futures indicated a dip, setting a cautious tone for traders as they prepare for a week filled with influential economic reports and Federal Reserve commentary.
Federal Reserve Chair Jerome Powell’s Testimony Jerome Powell will deliver his Semiannual Monetary Policy report to Congress, addressing the Senate Committee on Banking on Tuesday and the House Financial Services Committee on Wednesday. Investors will be keenly watching for any hints of weaker growth and inflation, which might signal potential interest rate cuts later this year.
Inflation Data and Earnings Season Kickoff Thursday’s consumer price index (CPI) release for June is another crucial event. The CPI will provide fresh insights into inflation trends, impacting market expectations for future Federal Reserve actions. Additionally, the first wave of second-quarter earnings reports will begin on Friday, with major companies like Delta Air Lines, PepsiCo, Citigroup, and JPMorgan Chase set to release their results.
Employment Trends The Conference Board’s employment trends index fell to 110.27 in June from a revised 111.04 in May, suggesting a slight slowdown in the U.S. job market. Despite adding 206,000 jobs in June, surpassing the forecast of 189,500, the unemployment rate edged up to 4.1% from 4% in May. This mixed labor market data might influence the Federal Reserve’s policy decisions, especially regarding potential interest rate cuts.
Sector Performance The S&P 500 and Nasdaq are aiming for their fifth consecutive session of gains, a feat not seen since early this year. Among the sectors, information technology leads, followed by industrials, financials, and consumer discretionary. However, consumer staples, energy, and communication services sectors are lagging.
Treasury Yields and Interest Rate Expectations Treasury yields extended recent losses as the labor market showed signs of cooling. The futures market reflects increased odds of a potential interest rate cut in September, driven by the nuanced job market data and Powell’s upcoming testimony.
Inflation appears to be in line with expectations, and the earnings season is starting strong, alleviating some immediate market concerns. However, risks remain, including a potential economic slowdown, rising unemployment, and vulnerabilities in small banks exposed to commercial and residential real estate sectors.
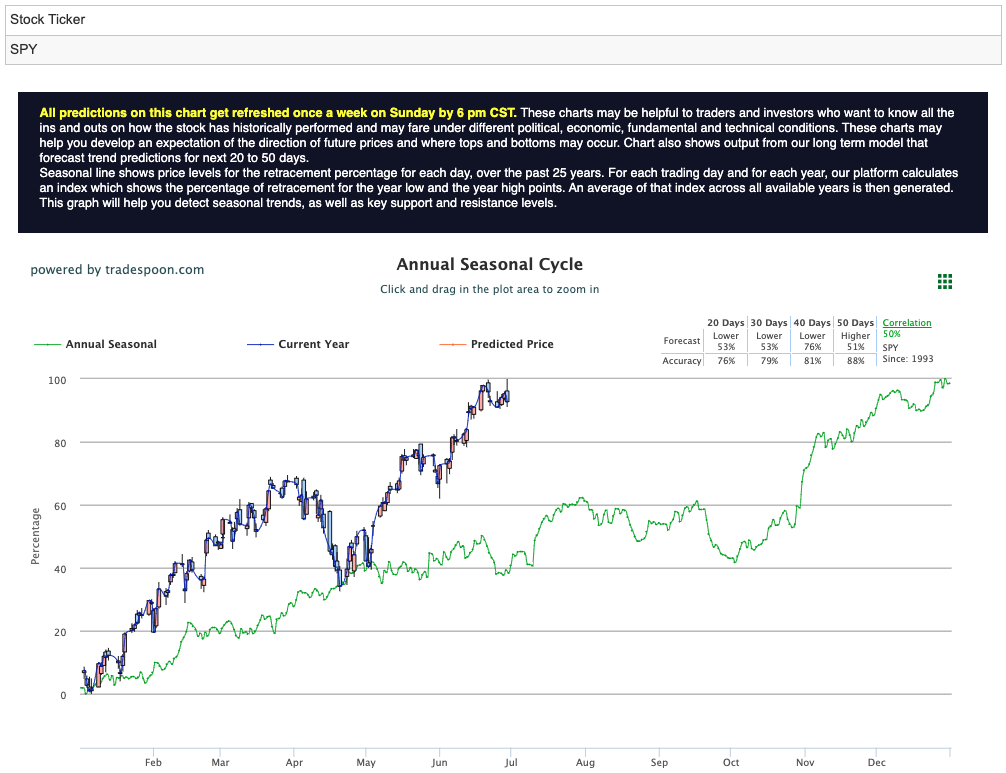
For the S&P 500 ETF (SPY), I project the rally to encounter resistance around the $550-$560 levels, with short-term support at $520-$530. The overall market trend is expected to continue posting higher highs and higher lows, fueled by favorable economic data and robust corporate earnings. For reference, the SPY Seasonal Chart is shown below:
As we move into the heart of summer, investors should brace for potential volatility but can remain cautiously optimistic given the strong economic indicators and corporate performance observed so far.
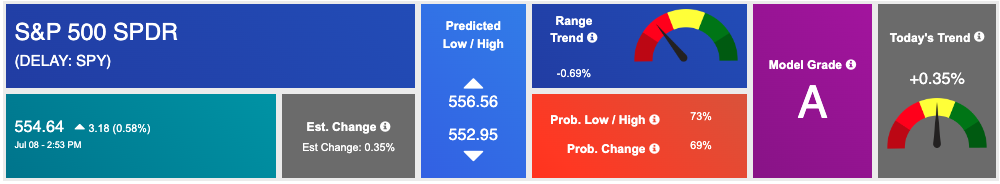
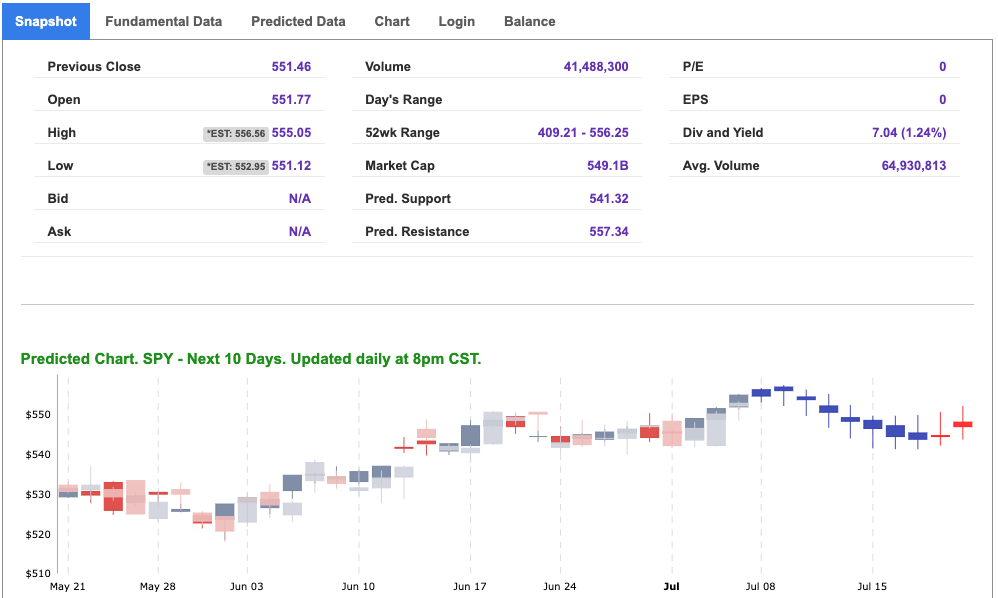
Using the “SPY” symbol to analyze the S&P 500 our 10-day prediction window shows a near-term positive outlook. Prediction data is uploaded after the market closes at 6 p.m. CST. Today’s data is based on market signals from the previous trading session.
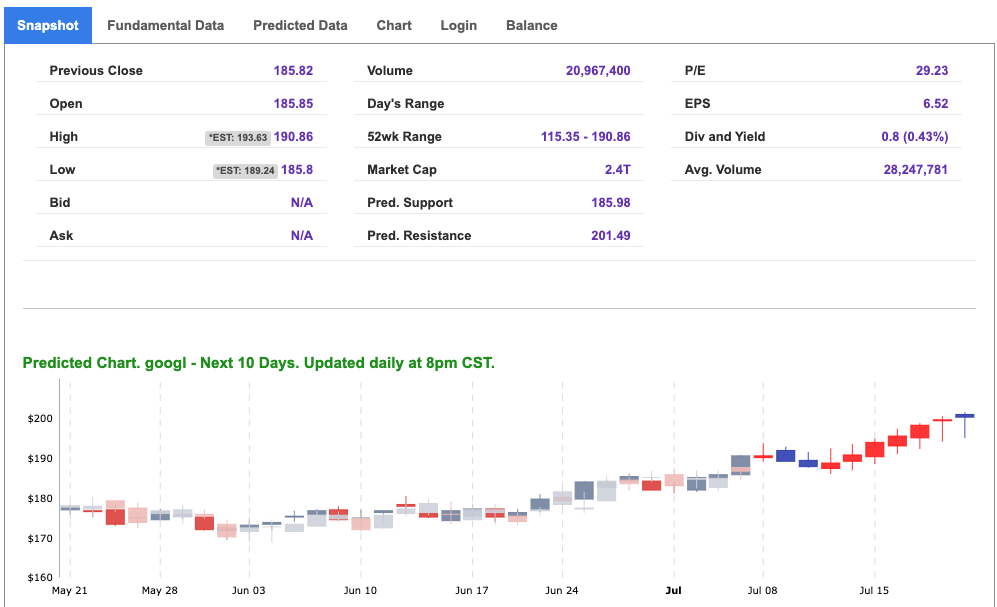
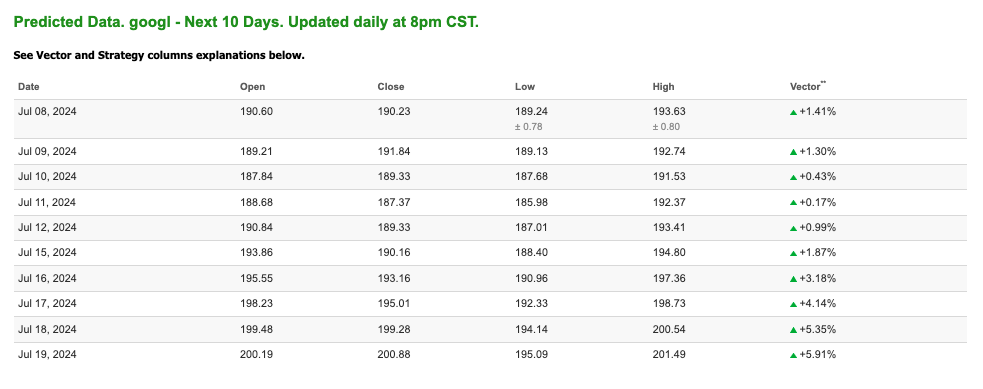
Note: The Vector column calculates the change of the Forecasted Average Price for the next trading session relative to the average of actual prices for the last trading session. The column shows the expected average price movement “Up or Down”, in percent. Trend traders should trade along the predicted direction of the Vector. The higher the value of the Vector the higher its momentum.
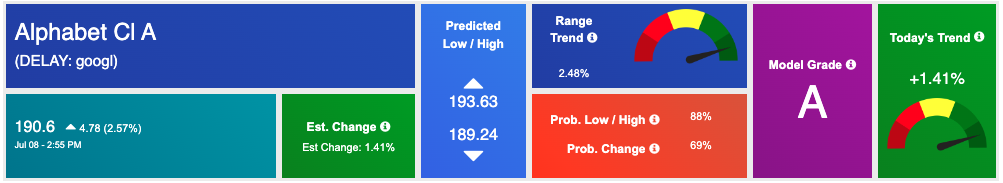
*Please note: At the time of publication Vlad Karpel does have a position in the featured symbol, googl. Our featured symbol is part of your free subscription service. It is not included in any paid Tradespoon subscription service. Vlad Karpel only trades his money in paid subscription services. If you are a paid subscriber, please review your Premium Member Picks, ActiveTrader, or MonthlyTrader recommendations. If you are interested in receiving Vlad’s picks, please click here.
West Texas Intermediate for Crude Oil delivery (CL.1) is priced at $82.25 per barrel, down 1.09%, at the time of publication.
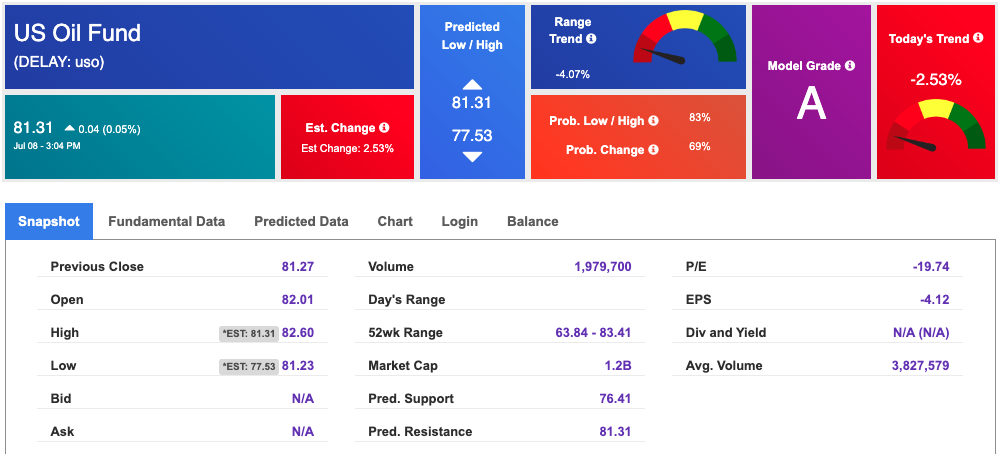
Looking at USO, a crude oil tracker, our 10-day prediction model shows mixed signals. The fund is trading at $81.31 at the time of publication. Prediction data is uploaded after the market close at 6 p.m., CST. Today’s data is based on market signals from the previous trading session.
The price for the Gold Continuous Contract (GC00) is down 1.28% at $2366.90 at the time of publication.
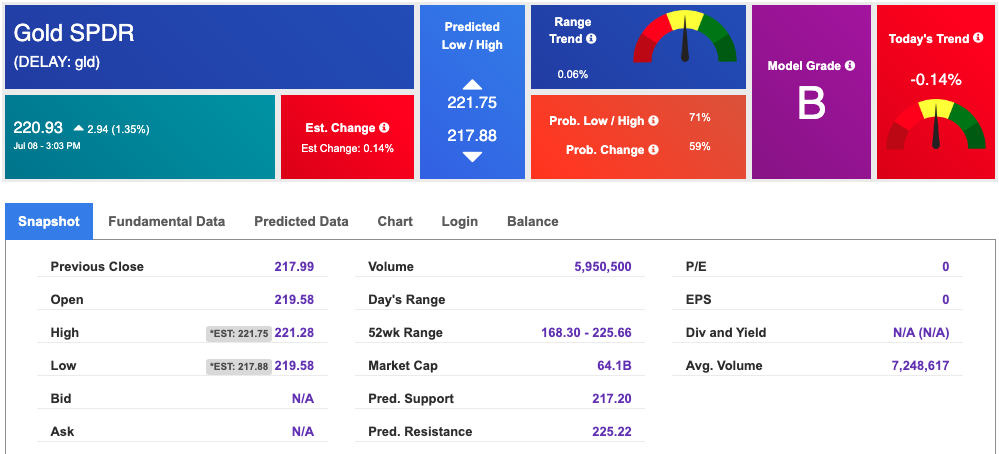
Using SPDR GOLD TRUST (GLD) as a tracker in our Stock Forecast Tool, the 10-day prediction window shows mixed signals. The gold proxy is trading at $220.93 at the time of publication. Vector signals show -0.14% for today. Prediction data is uploaded after the market close at 6 p.m., CST. Today’s data is based on market signals from the previous trading session.
The yield on the 10-year Treasury note is down at 4.279% at the time of publication.
The yield on the 30-year Treasury note is down at 4.462% at the time of publication.
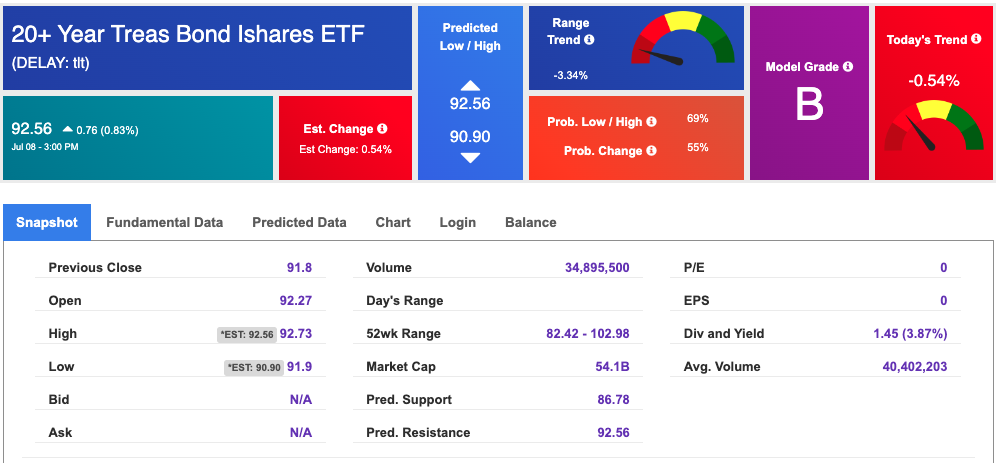
Using the iShares 20+ Year Treasury Bond ETF (TLT) as a proxy for bond prices in our Stock Forecast Tool, we see mixed signals in our 10-day prediction window. Prediction data is uploaded after the market close at 6 p.m., CST. Today’s data is based on market signals from the previous trading session.
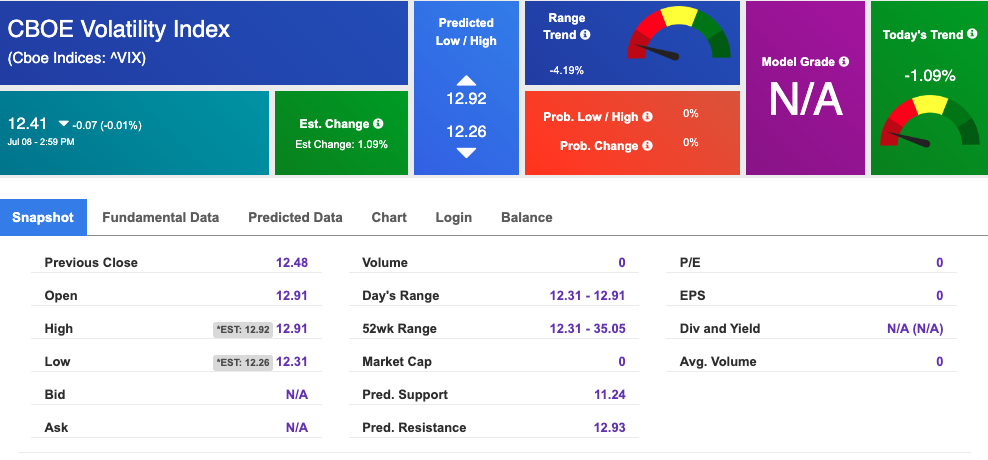
The CBOE Volatility Index (^VIX) is priced at $12.41 down 0.01% at the time of publication, and our 10-day prediction window shows mixed signals. Prediction data is uploaded after the market close at 6 p.m., CST. Today’s data is based on market signals from the previous trading session.
Please share this Tradespoon Market Commentary with your friends.
![]()

![]()
Comments Off on


Tradespoon Tools make finding winning trades in minute as easy as 1-2-3.
Our simple 3 step approach has resulted in an average return of almost 20% per trade!

