On Wednesday, the stock market experienced a dip as investors closely analyzed the latest remarks from Federal Reserve officials for clues on the future direction of interest rates. All three major U.S. indices finished in the red, as multiple Fed officials’ comments this week spooked investors. Still to come this week are several key earnings reports, including those from PayPal, AbbVie, Lyft, PepsiCo, and Philip Morris.
The technology sector saw steep losses, with Alphabet experiencing a significant drop of more than 7%, significantly impacting the Nasdaq. Microsoft (MSFT), on the other hand, saw a slightly smaller decrease of less than 1%. The company recently announced it will be launching its own ChatGPT-enabled search product. Meta stock was also on the decline today while oil rose as the dollar dipped.
These losses come after an optimistic Tuesday, where all three indexes saw gains, with the S&P 500 and Nasdaq both rising by over 1%. Federal Reserve Chairman Jerome Powell emphasized the need for further interest rate hikes to curb inflation. However, this news was already known to the market, as the Fed plans to implement a few more increases. What came as a surprise was Powell’s mention of inflation likely declining throughout the year, signaling that the Fed may be approaching the end of its interest rate-hike cycle.
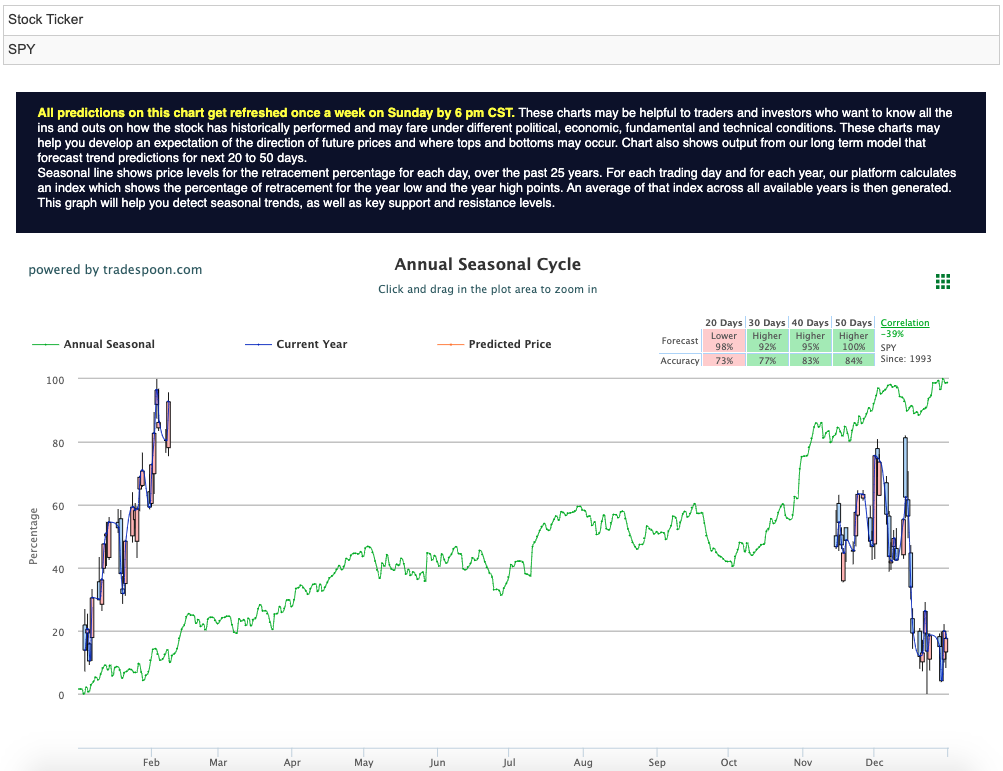
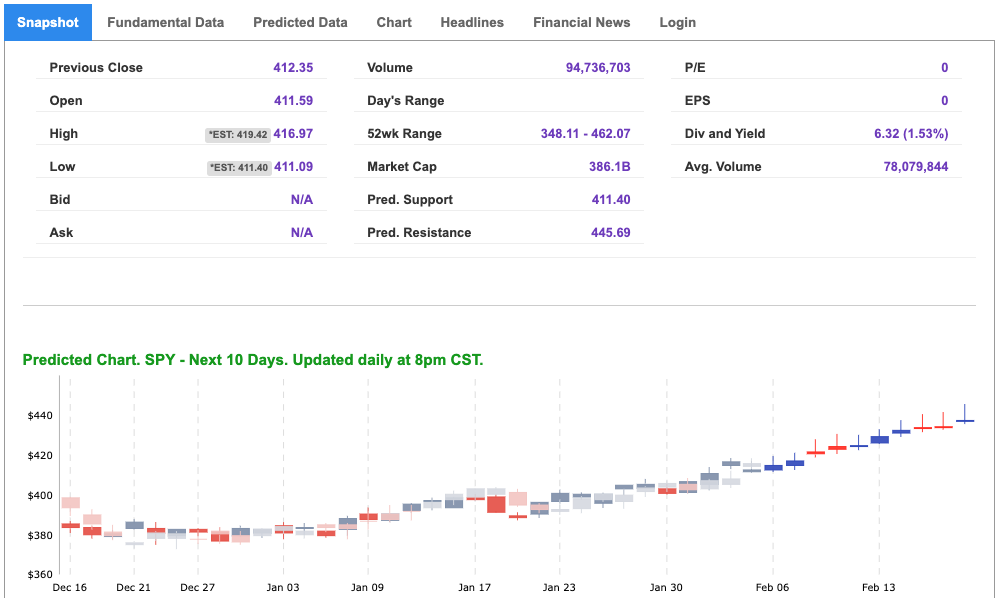
The VIX is currently trading near the $20 level and the earnings of companies such as Disney (DIS), Uber (UBER), and CVS (CVS), along with the market’s reaction to Jerome Powell’s press conference, are likely to impact the market’s next move. We are closely monitoring the overhead resistance levels in the SPY, which are situated at 420 and 430, respectively; the SPY support levels are at 410 and 402. Based on this analysis, we expect the market to remain sideways in the next two to eight weeks. We suggest that, at this time, market participants adopt a neutral stance and consider hedging their positions. Market commentary readers should maintain clearly defined stop levels for all positions. For reference, the SPY Seasonal Chart is shown below:


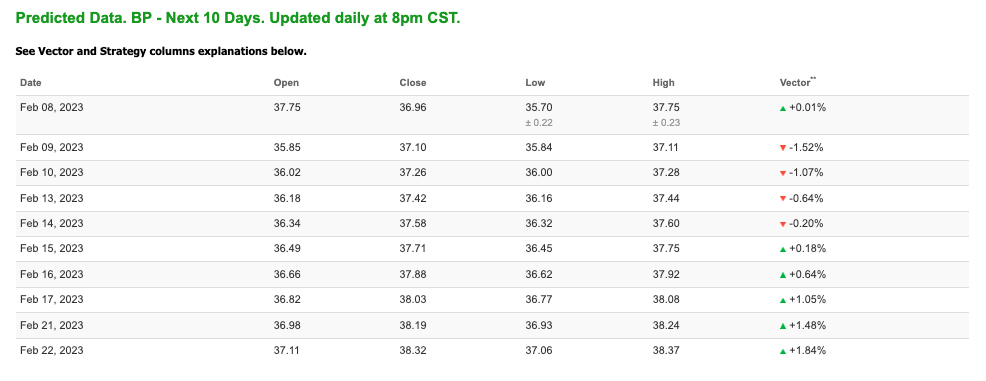
Note: The Vector column calculates the change of the Forecasted Average Price for the next trading session relative to the average of actual prices for the last trading session. The column shows the expected average price movement “Up or Down”, in percent. Trend traders should trade along the predicted direction of the Vector. The higher the value of the Vector the higher its momentum.
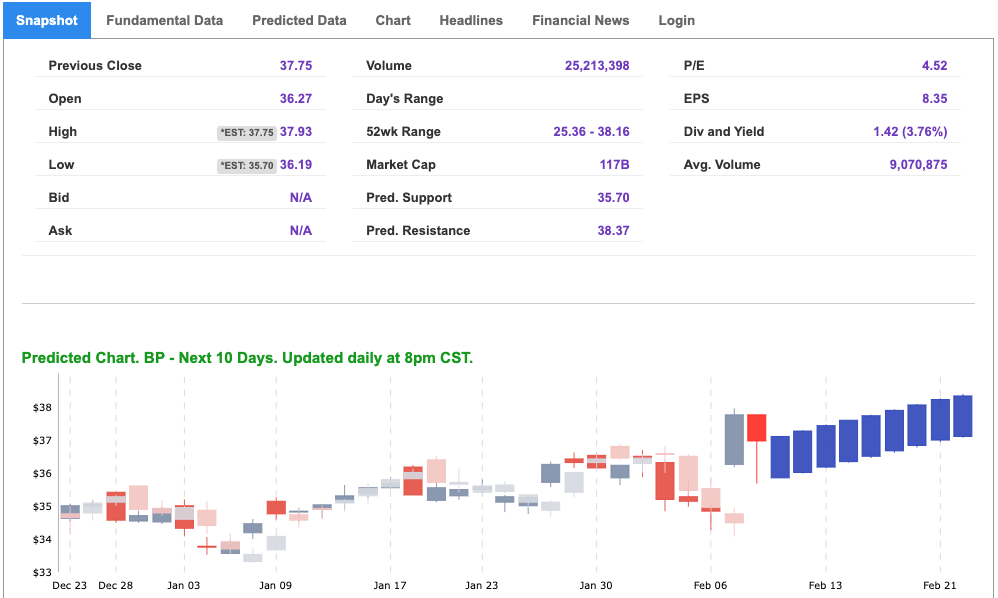
*Please note: At the time of publication Vlad Karpel does have a position in the featured symbol, bp. Our featured symbol is part of your free subscription service. It is not included in any paid Tradespoon subscription service. Vlad Karpel only trades his money in paid subscription services. If you are a paid subscriber, please review your Premium Member Picks, ActiveTrader, or MonthlyTrader recommendations. If you are interested in receiving Vlad’s picks, please click here.
West Texas Intermediate for Crude Oil delivery (CL.1) is priced at $78.48 per barrel, up 1.74%, at the time of publication.
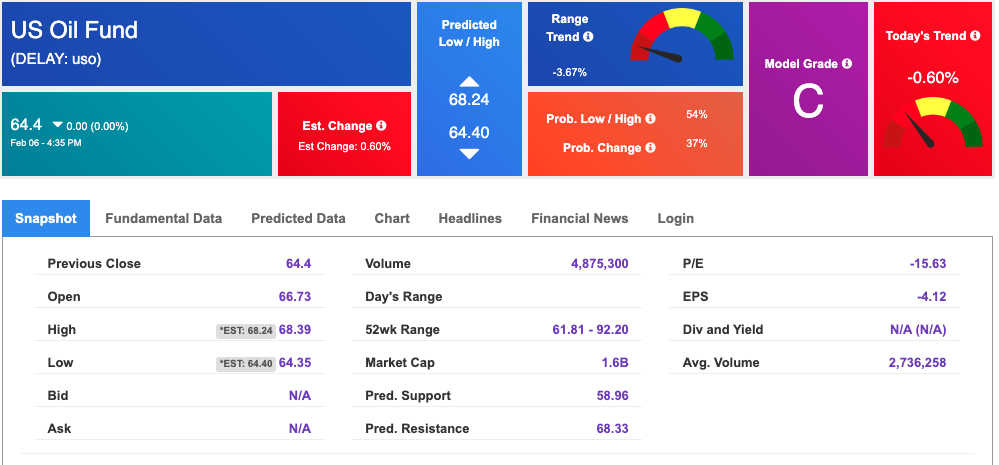
Looking at USO, a crude oil tracker, our 10-day prediction model shows mixed signals. The fund is trading at $64.4 at the time of publication. Prediction data is uploaded after the market close at 6 p.m., CST. Today’s data is based on market signals from the previous trading session.
The price for the Gold Continuous Contract (GC00) is up 0.18% at $1888.10 at the time of publication.
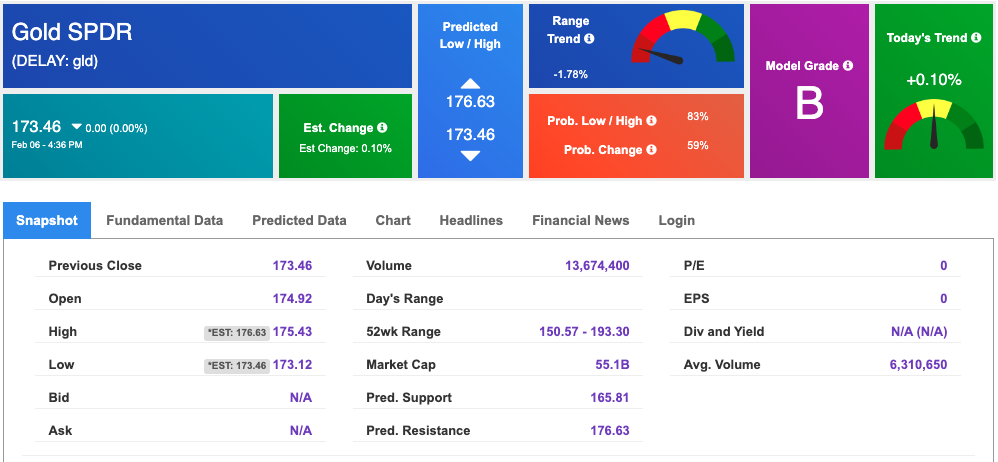
Using SPDR GOLD TRUST (GLD) as a tracker in our Stock Forecast Tool, the 10-day prediction window shows mixed signals. The gold proxy is trading at $173.46 at the time of publication. Vector signals show +0.10% for today. Prediction data is uploaded after the market close at 6 p.m., CST. Today’s data is based on market signals from the previous trading session.
The yield on the 10-year Treasury note is down at 3.621% at the time of publication.
The yield on the 30-year Treasury note is down at 3.674% at the time of publication.
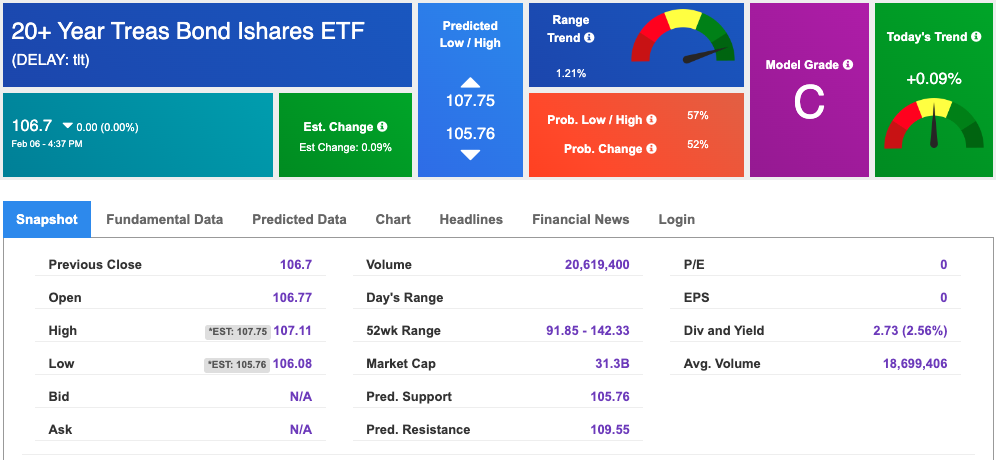
Using the iShares 20+ Year Treasury Bond ETF (TLT) as a proxy for bond prices in our Stock Forecast Tool, we see mixed signals in our 10-day prediction window. Prediction data is uploaded after the market close at 6 p.m., CST. Today’s data is based on market signals from the previous trading session.
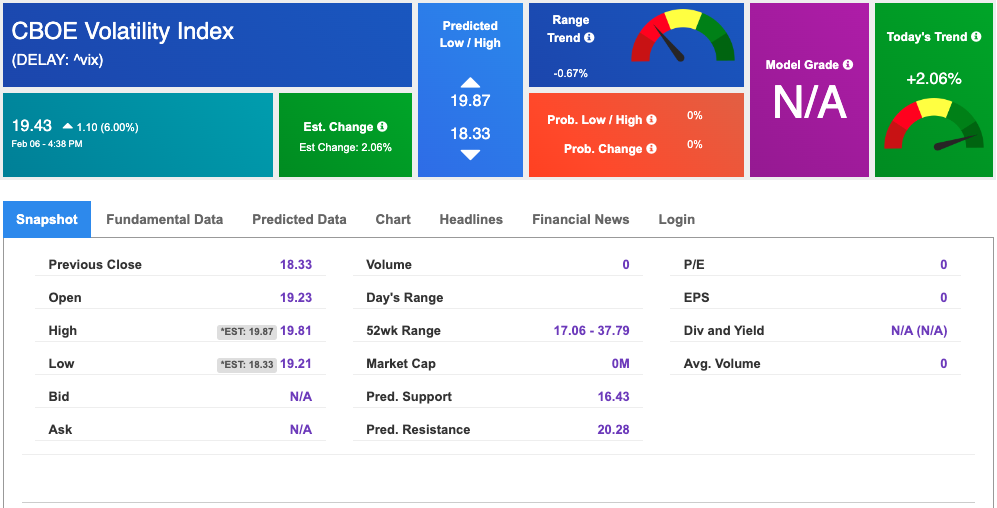
The CBOE Volatility Index (^VIX) is $19.43 at the time of publication, and our 10-day prediction window shows mixed signals. Prediction data is uploaded after the market close at 6 p.m., CST. Today’s data is based on market signals from the previous trading session.
Comments Off on
Tradespoon Tools make finding winning trades in minute as easy as 1-2-3.
Our simple 3 step approach has resulted in an average return of almost 20% per trade!