 Special Offer: Try the 'Vlad's Portfolio Membership' for ONLY $37!
CLICK HERE TO LEARN MORE
Special Offer: Try the 'Vlad's Portfolio Membership' for ONLY $37!
CLICK HERE TO LEARN MORE
As the trading week began, investors braced themselves for a rollercoaster ride amidst a flurry of economic data releases and unexpected market movements. With inflation concerns looming large and the Federal Reserve’s interest rate decisions hanging in the balance, the stage was set for a week of uncertainty and volatility across various sectors.
Inflation Data Takes Center Stage
The week kicked off with stocks fluctuating as investors awaited crucial inflation data, including the producer-price index (PPI) and consumer-price index (CPI). These releases held significant weight, with the potential to either validate or disrupt prevailing expectations regarding future interest rate adjustments by the Federal Reserve. The market’s rally persisted, with the S&P 500 hovering around record levels, albeit with a cautious eye on Wednesday’s consumer price index for April. The April consumer price index would serve as a litmus test, determining whether signs of cooling inflation would fuel hopes of imminent rate cuts or if another surge would send shockwaves through the market.
The Return of Meme Stocks
Amidst the backdrop of inflationary concerns, meme stocks made a dramatic resurgence, captivating market attention. GameStop, in particular, experienced extreme volatility, prompting trading halts on the New York Stock Exchange. The catalyst for this frenzy was Keith Gill, famously known as “Roaring Kitty,” resurfacing with a social media post. Highly shorted stocks like GameStop and AMC Entertainment witnessed substantial surges, while speculative assets like cryptocurrencies also saw positive momentum.
Tesla’s Strategic Financing Move
In the electric vehicle space, Tesla made headlines by launching a below-market financing rate for its Model Y purchases. Offering a 0.99% annual percentage rate represented a significant shift from the previously quoted rate of 6.49% APR. While this move aimed to stimulate demand, it also hinted at the challenges of sustaining growth in the face of slowing demand for electric vehicles.
Consumer Sentiment and Market Indicators
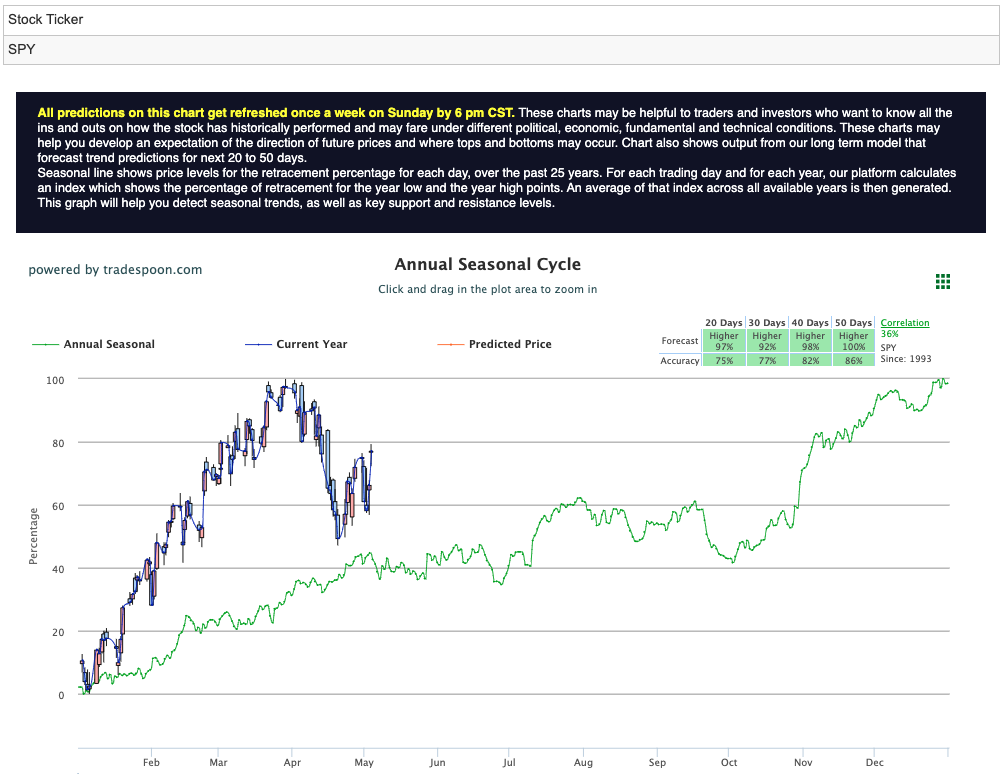
Last week’s consumer sentiment report depicted a sobering outlook, mirroring growing concerns regarding inflation, unemployment, and higher interest rates. Rising inflation expectations, alongside cautious market sentiment, intensified the atmosphere of uncertainty. Technical indicators, such as the 50-day moving averages (DMA) for QQQ and SPY, were closely monitored, providing insights into market direction amidst turbulence. Forecasts indicated potential resistance levels for major indices like SPY, prompting concerns about a plateauing rally. Projections suggest that SPY may encounter resistance within the $530-$540 range while finding short-term support between $480-$500 in the upcoming months, marking a pivotal moment where market sentiment could potentially shift. For reference, the SPY Seasonal Chart is shown below:
Looking Ahead
As the week drew to a close, investors remained on edge, anticipating further market movements driven by economic data releases, corporate earnings, and ongoing geopolitical developments. The path forward remained uncertain, underscoring the importance of vigilance and adaptability in navigating volatile market conditions. The week will also feature earnings reports from a slew of major companies, including Walmart, Home Depot, and Alibaba, providing insights into the health of various sectors. However, despite recent market highs, there was a growing sense of caution among investors.
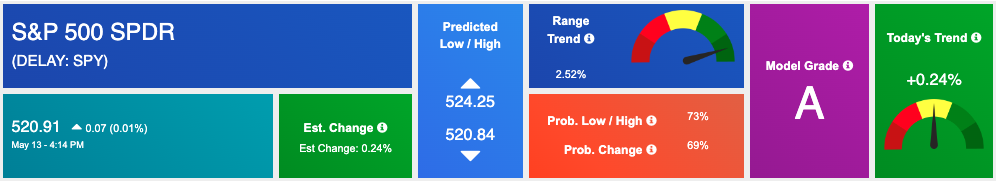
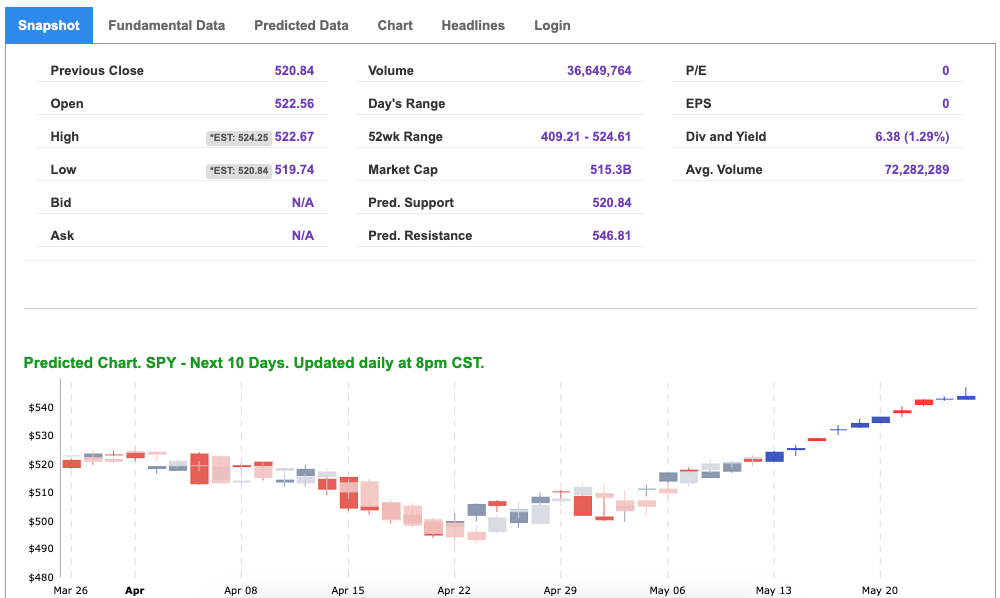
Using the “SPY” symbol to analyze the S&P 500 our 10-day prediction window shows a near-term positive outlook. Prediction data is uploaded after the market closes at 6 p.m. CST. Today’s data is based on market signals from the previous trading session.
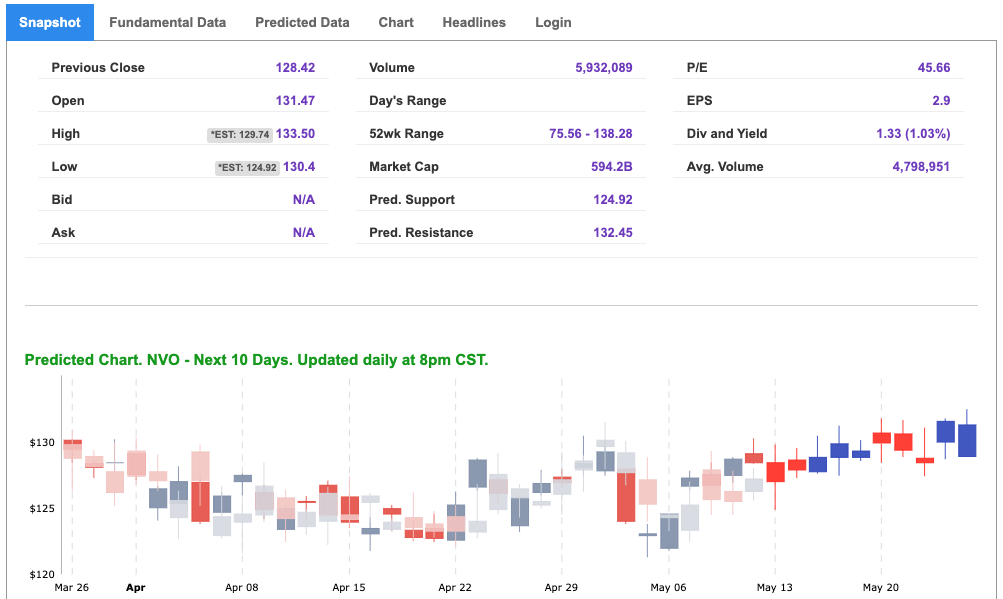
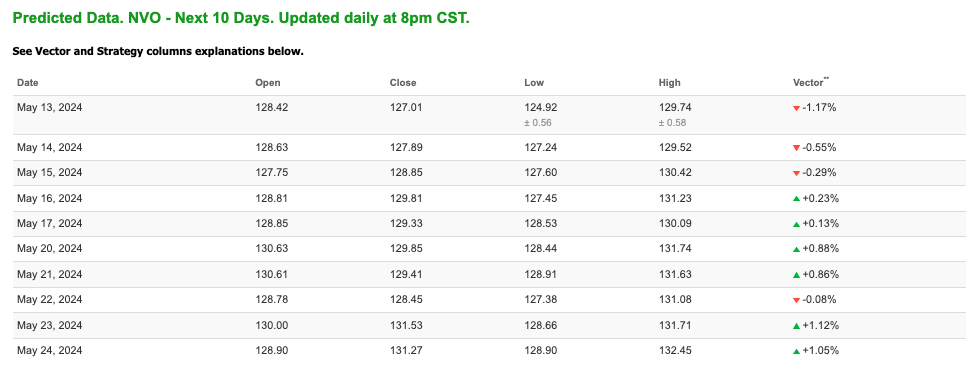
Note: The Vector column calculates the change of the Forecasted Average Price for the next trading session relative to the average of actual prices for the last trading session. The column shows the expected average price movement “Up or Down”, in percent. Trend traders should trade along the predicted direction of the Vector. The higher the value of the Vector the higher its momentum.
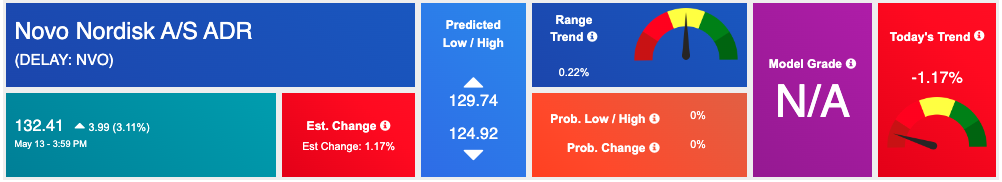
*Please note: At the time of publication Vlad Karpel does have a position in the featured symbol, nvo. Our featured symbol is part of your free subscription service. It is not included in any paid Tradespoon subscription service. Vlad Karpel only trades his money in paid subscription services. If you are a paid subscriber, please review your Premium Member Picks, ActiveTrader, or MonthlyTrader recommendations. If you are interested in receiving Vlad’s picks, please click here.
West Texas Intermediate for Crude Oil delivery (CL.1) is priced at $79.20 per barrel, up 1.20%, at the time of publication.
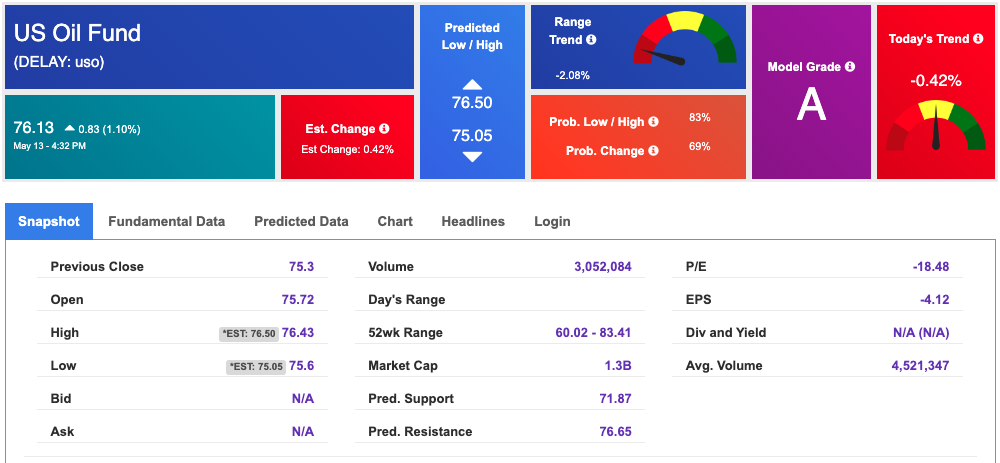
Looking at USO, a crude oil tracker, our 10-day prediction model shows mixed signals. The fund is trading at $76.13 at the time of publication. Prediction data is uploaded after the market close at 6 p.m., CST. Today’s data is based on market signals from the previous trading session.
The price for the Gold Continuous Contract (GC00) is down 1.38% at $2342.30 at the time of publication.
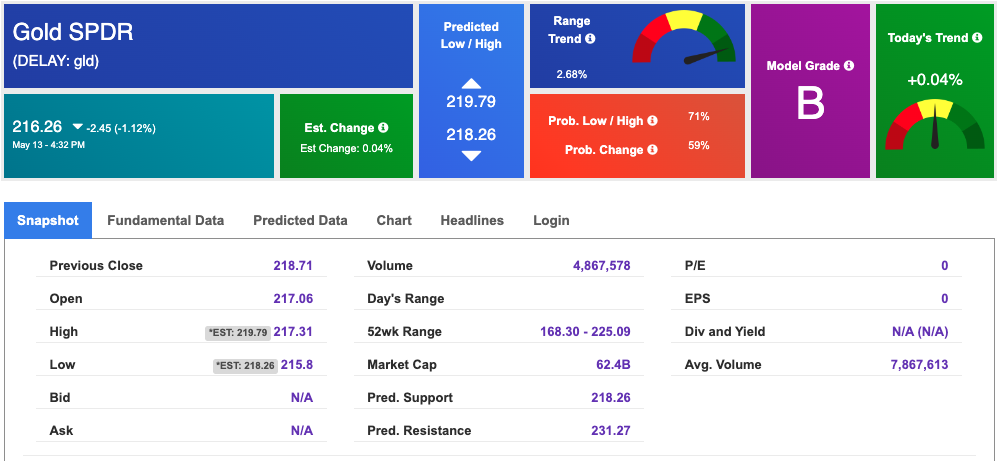
Using SPDR GOLD TRUST (GLD) as a tracker in our Stock Forecast Tool, the 10-day prediction window shows mixed signals. The gold proxy is trading at $216.26 at the time of publication. Vector signals show +0.04% for today. Prediction data is uploaded after the market close at 6 p.m., CST. Today’s data is based on market signals from the previous trading session.
The yield on the 10-year Treasury note is down at 4.493% at the time of publication.
The yield on the 30-year Treasury note is down at 4.637% at the time of publication.
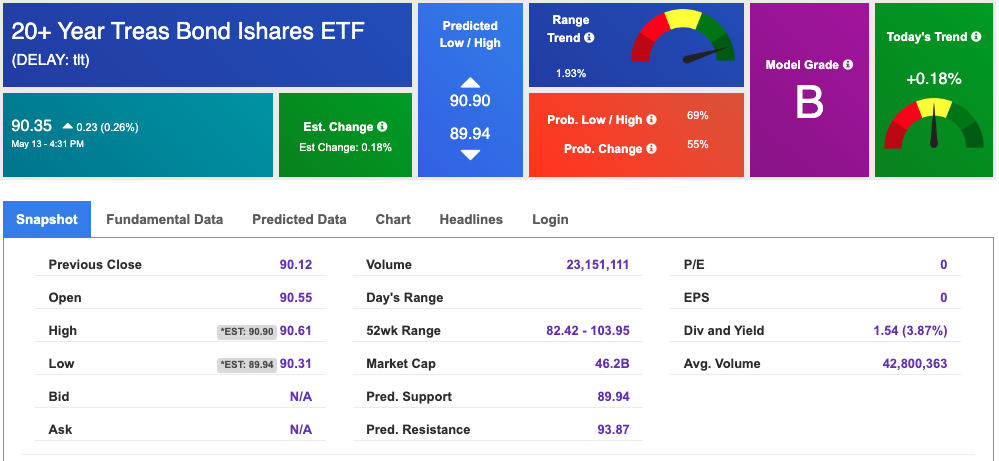
Using the iShares 20+ Year Treasury Bond ETF (TLT) as a proxy for bond prices in our Stock Forecast Tool, we see mixed signals in our 10-day prediction window. Prediction data is uploaded after the market close at 6 p.m., CST. Today’s data is based on market signals from the previous trading session.
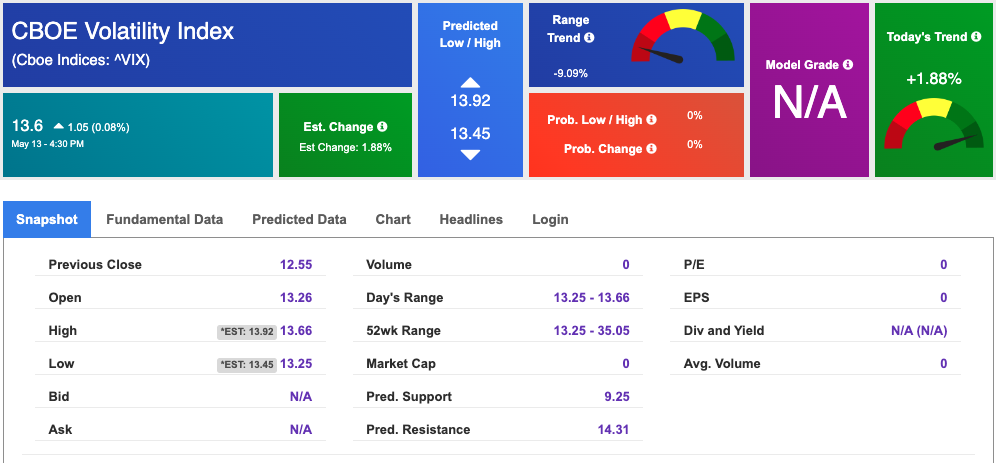
The CBOE Volatility Index (^VIX) is priced at $13.6 up 0.08% at the time of publication, and our 10-day prediction window shows mixed signals. Prediction data is uploaded after the market close at 6 p.m., CST. Today’s data is based on market signals from the previous trading session.
Please share this Tradespoon Market Commentary with your friends.
![]()

![]()
Comments Off on


Tradespoon Tools make finding winning trades in minute as easy as 1-2-3.
Our simple 3 step approach has resulted in an average return of almost 20% per trade!

