As the first quarter of 2023 comes to an end, the stock market continues to waver, with a slight upward trend driven by the technology sector. This comes as fears about banking turmoil have started to ease. Short-term Treasury yields are declining, indicating a general shift towards safe-haven assets. The upcoming earnings season will be crucial for the market’s future direction, as analysts predict a decline in earnings per share in the first quarter of 2023 compared to that of the previous year. This uncertainty is further compounded by comments from several Fed officials about the central bank’s potential move at its next meeting.
Richmond Fed President Thomas Barkin sees a “pretty wide” range of outcomes for the May meeting, while Boston Fed President Susan Collins anticipates “modest” additional tightening. Meanwhile, Minneapolis Fed President Neel Kashkari said the Fed has more work to do to bring services inflation down. The latest economic data, however, has added some positive sentiment to the markets. The number of people who filed for unemployment benefits in the U.S. last week rose slightly above economists’ projections, suggesting some softening in a labor market that is still historically strong.
The market sentiment at the end of the first quarter will likely be decided by the inflation data for February, due out on Friday. The annual rate of the Federal Reserve’s favorite inflation gauge, the core PCE index, is expected to hold steady at 4.7%. Globally, Asian markets traded with mixed results while European markets closed in the green.
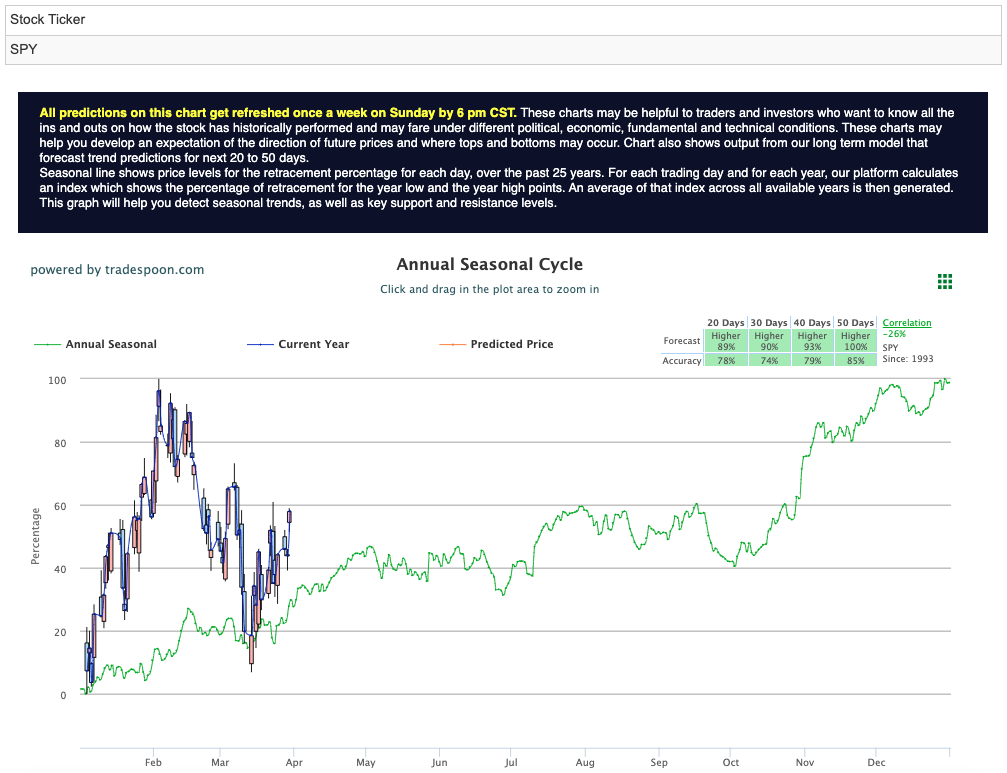
As the $VIX trades near the $21 level, upcoming earnings reports from companies like $MU and $WBA, as well as liquidity issues in regional and global banks, could influence the market’s next move. Overhead resistance levels in the SPY are presently at $402 and then $408, while support is at $392 and then $384. With the market expected to trade sideways for the next 2-8 weeks, we recommend being market-neutral and encouraging subscribers to hedge their positions. Market commentary readers should maintain clearly defined stop levels for all positions. For reference, the SPY Seasonal Chart is shown below:

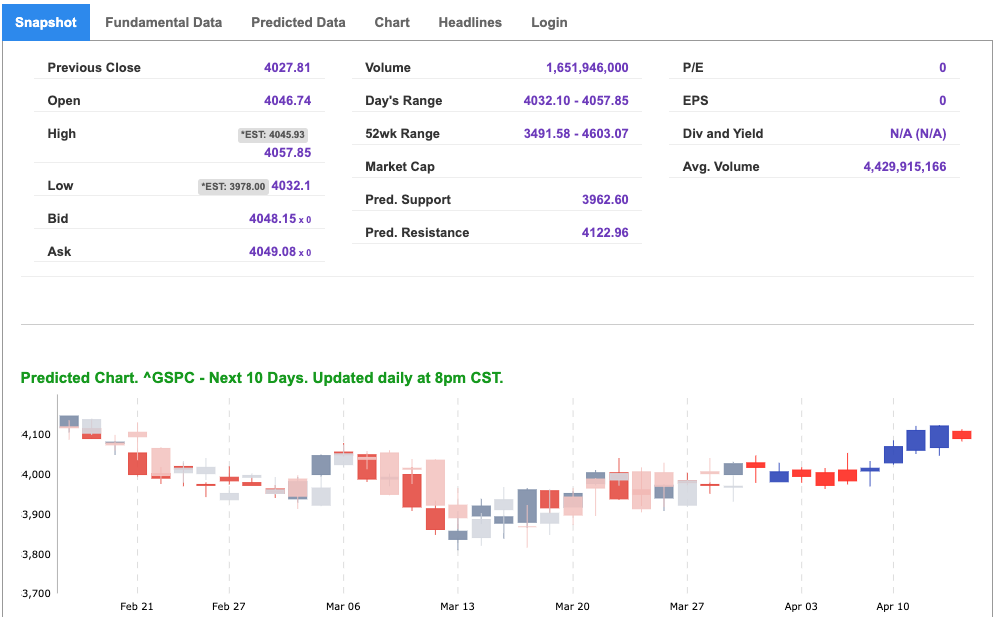

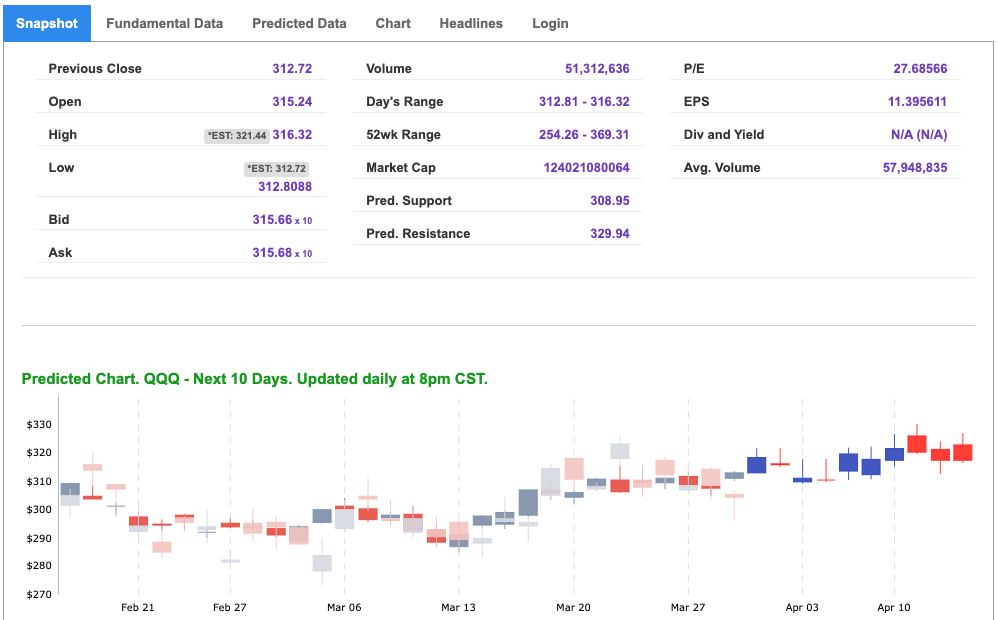
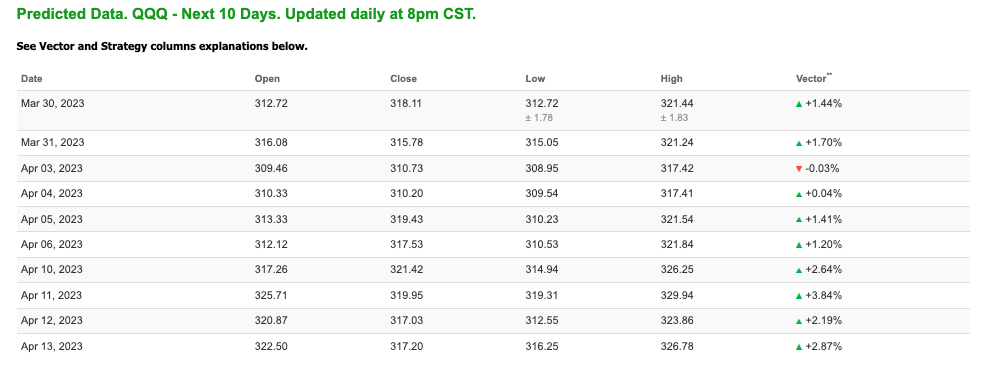
Note: The Vector column calculates the change of the Forecasted Average Price for the next trading session relative to the average of actual prices for the last trading session. The column shows the expected average price movement “Up or Down”, in percent. Trend traders should trade along the predicted direction of the Vector. The higher the value of the Vector the higher its momentum.
*Please note: At the time of publication Vlad Karpel does have a position in the featured symbol, qqq. Our featured symbol is part of your free subscription service. It is not included in any paid Tradespoon subscription service. Vlad Karpel only trades his money in paid subscription services. If you are a paid subscriber, please review your Premium Member Picks, ActiveTrader, or MonthlyTrader recommendations. If you are interested in receiving Vlad’s picks, please click here.
West Texas Intermediate for Crude Oil delivery (CL.1) is priced at $74.19 per barrel, up 1.67%, at the time of publication.
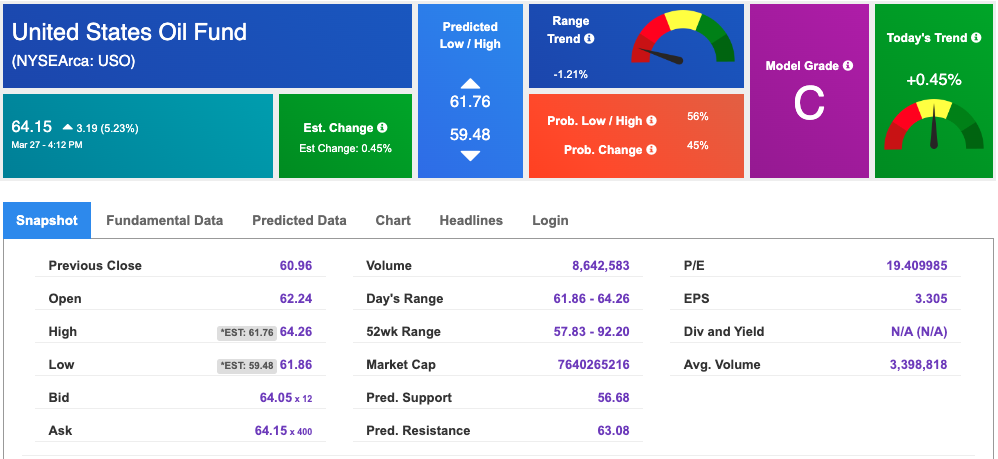
Looking at USO, a crude oil tracker, our 10-day prediction model shows mixed signals. The fund is trading at $64.15 at the time of publication. Prediction data is uploaded after the market close at 6 p.m., CST. Today’s data is based on market signals from the previous trading session.
The price for the Gold Continuous Contract (GC00) is up 1.70% at $2000.50 at the time of publication.
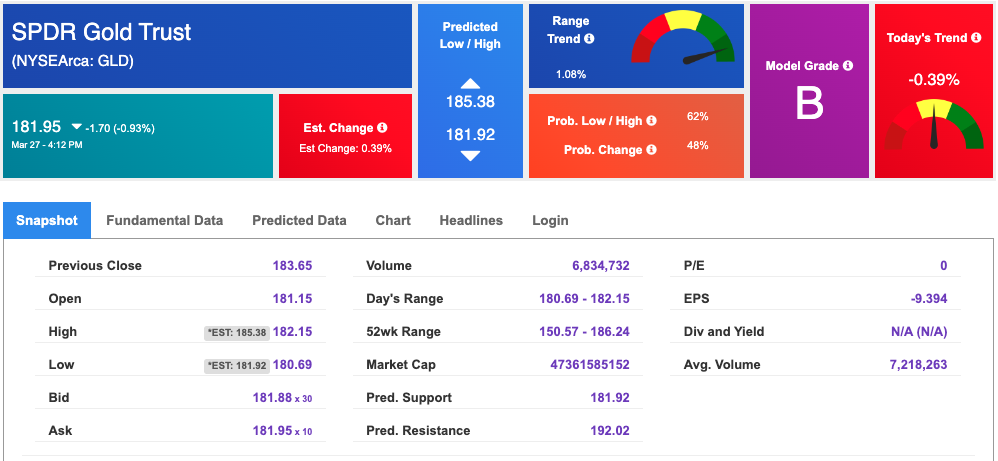
Using SPDR GOLD TRUST (GLD) as a tracker in our Stock Forecast Tool, the 10-day prediction window shows mixed signals. The gold proxy is trading at $181.95 at the time of publication. Vector signals show -0.39% for today. Prediction data is uploaded after the market close at 6 p.m., CST. Today’s data is based on market signals from the previous trading session.
The yield on the 10-year Treasury note is down at 3.549% at the time of publication.
The yield on the 30-year Treasury note is down at 3.737% at the time of publication.
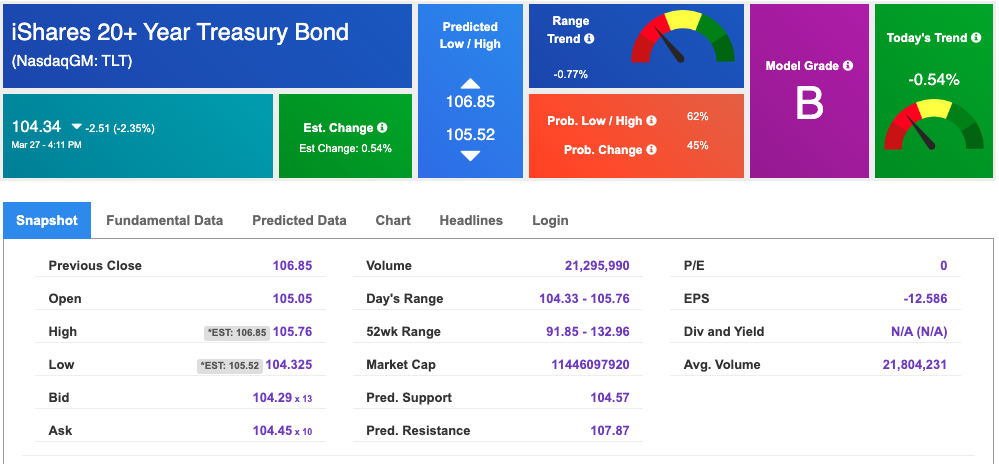
Using the iShares 20+ Year Treasury Bond ETF (TLT) as a proxy for bond prices in our Stock Forecast Tool, we see mixed signals in our 10-day prediction window. Prediction data is uploaded after the market close at 6 p.m., CST. Today’s data is based on market signals from the previous trading session.
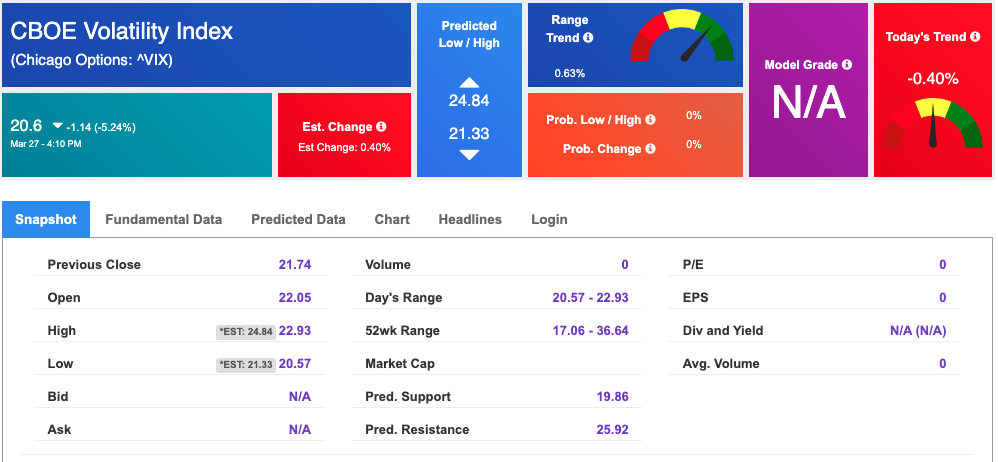
The CBOE Volatility Index (^VIX) is $20.6 at the time of publication, and our 10-day prediction window shows mixed signals. Prediction data is uploaded after the market close at 6 p.m., CST. Today’s data is based on market signals from the previous trading session.
Comments Off on
Tradespoon Tools make finding winning trades in minute as easy as 1-2-3.
Our simple 3 step approach has resulted in an average return of almost 20% per trade!