 Special Offer: Try the 'Elite Trading Circle Membership' for ONLY $37!
CLICK HERE TO LEARN MORE
Special Offer: Try the 'Elite Trading Circle Membership' for ONLY $37!
CLICK HERE TO LEARN MORE
The past week saw significant turbulence across U.S. equity markets, with the Dow Jones Industrial Average closing over 2% lower, the S&P 500 also retreating, and the Nasdaq Composite dropping over 3%. The Nasdaq even briefly entered and exited correction territory, a reflection of the heightened uncertainty surrounding both economic data and geopolitical events. The S&P 500 dipped below its 200-day moving average for a short period, further illustrating the challenging market environment.
One of the key factors contributing to this volatility is the ongoing tariff saga, which has become a central concern for investors. Tariffs can create ripple effects throughout the economy in multiple ways. First, companies that rely on imported goods face higher costs, which can erode profit margins and negatively affect stock prices. Second, businesses may pass these increased costs onto consumers, potentially reducing their purchasing power and leading to slower economic growth. This combination of impacts raises fears that tariffs could push the economy into recession.
Moreover, these potential price hikes arrive at a time when inflation remains persistent, compounding concerns for both the Federal Reserve and consumers. The Fed is already grappling with inflationary pressures, and additional shocks to prices could make it harder for policymakers to justify aggressive rate cuts. This uncertainty over tariffs has created a volatile environment for both businesses and consumers, with little clarity on the future direction of President Trump’s trade policies.
Since the beginning of February, Trump has announced several rounds of tariffs, including 25% on imports from Canada and Mexico and 10% on Chinese goods. However, these measures have been delayed multiple times, adding further confusion to the landscape. Initially, Trump postponed the tariffs on Canada and Mexico to allow for negotiations under the United States-Mexico-Canada Agreement (USMCA). But just weeks later, he announced the tariffs would go into effect, only to delay some of them once again, further muddling expectations.
With trade policy remaining in flux, investors are left trying to navigate a labyrinth of conflicting signals. The market’s reaction to these policy shifts has been unpredictable, contributing to the heightened volatility seen throughout the week.
Economic data releases also added to the complexity of the market’s outlook. The ADP employment report, released on March 5, revealed a disappointing private-sector payroll growth of just 77,000 jobs—well below consensus expectations and marking the weakest reading since July 2024. This unexpected slowdown, combined with trade policy uncertainties, has raised fears of a potential economic deceleration.
Additionally, the Federal Reserve’s latest meeting minutes, released last week, signaled that the central bank is resistant to cutting interest rates in the near term. This has dampened market hopes for a more dovish approach, as traders had been hoping for more accommodative monetary policy to support economic growth. Treasury yields exhibited volatility throughout the week, with the 10-year yield swinging between 3.6% and 4.8% before ultimately trending lower in response to tariff news and the Fed’s stance.
Several key earnings reports last week further influenced market sentiment. Nvidia remained a standout, continuing its strong performance thanks to robust demand for AI and server sales. This lifted both Nvidia’s stock and that of Super Micro Computer, which benefited from the same trends. Tesla also saw modest gains, as a delay in tariffs alleviated concerns over supply chain disruptions, providing some respite for the electric vehicle maker.
However, other companies struggled. Best Buy warned of rising import costs, which led to higher prices, weighing heavily on its stock. Ross Stores delivered better-than-expected earnings, but its stock saw limited movement as consumer spending appeared more cautious. Box, on the other hand, fell sharply after issuing disappointing forward guidance, leading to a decline in investor confidence.
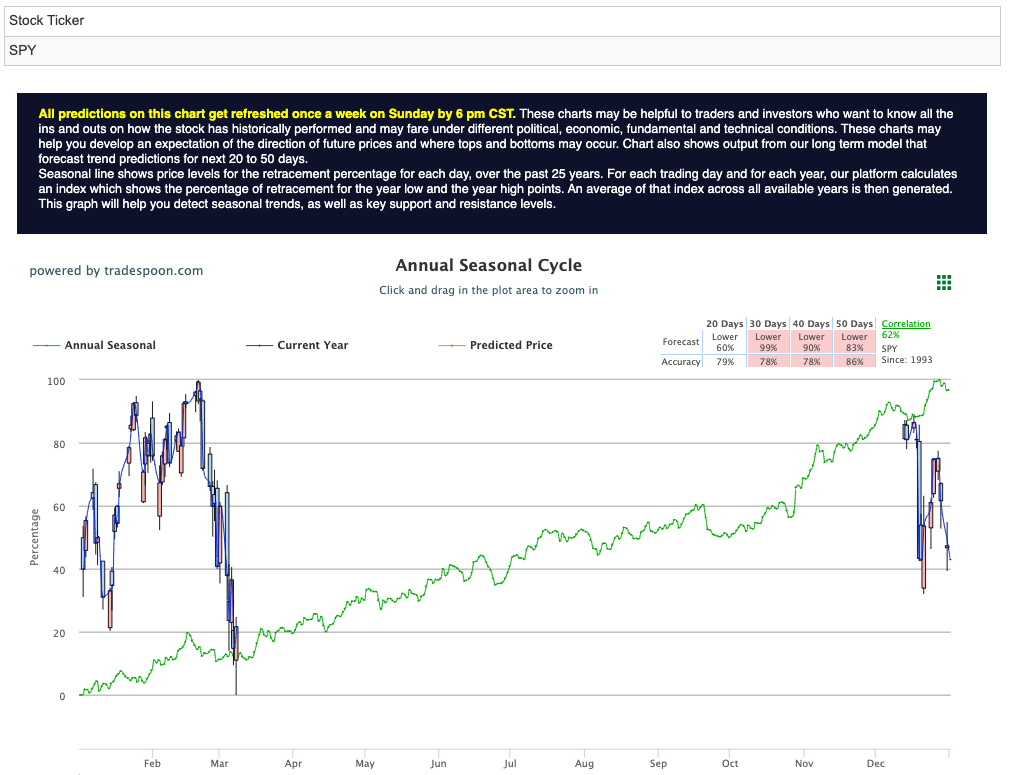
Investor sentiment remains fragile, as indicated by the VIX, which surged to 24, signaling ongoing caution in the market. While the S&P 500 has managed to stay within a defined range, its near-term support rests at 560-580, with resistance between 620-640. The broader uptrend remains intact, but short-term fluctuations persist as traders assess the potential impact of economic data, inflationary pressures, and geopolitical risks. For reference, the SPY Seasonal Chart is shown below:
The market continues to face heightened uncertainty, with the Nasdaq still in correction territory and bond yields fluctuating based on evolving expectations regarding monetary policy. Traders and investors will need to stay agile as they navigate this unpredictable environment.
Looking ahead, all eyes will be on trade negotiations, updates from the Federal Reserve on monetary policy, and key economic indicators. Analysts from JPMorgan have suggested that it may take longer for the stock market to reach year-end targets, with uncertainties surrounding tariffs, interest rates, and global economic growth lingering as key issues. However, Broadcom’s strong earnings outlook has provided some reassurance to investors with an eye on the AI sector.
As the earnings season continues, it will offer critical insights into corporate profitability and the resilience of the broader economy. Major financial institutions and tech giants are set to report in the coming weeks, and their results could provide direction for market momentum moving forward. With geopolitical tensions, inflation concerns, and Federal Reserve policy decisions all in focus, market participants will need to remain vigilant and prepared for continued fluctuations.
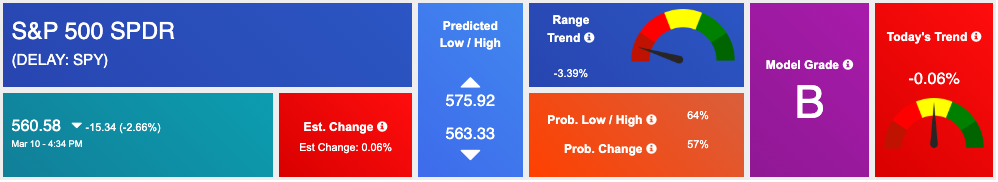
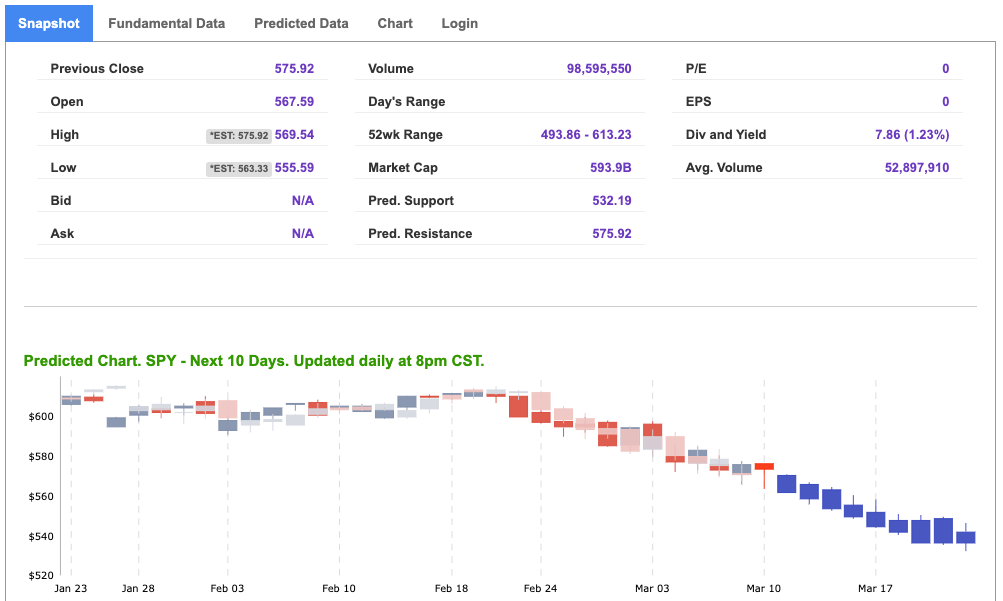
Using the “SPY” symbol to analyze the S&P 500 our 10-day prediction window shows a near-term positive outlook. Prediction data is uploaded after the market closes at 6 p.m. CST. Today’s data is based on market signals from the previous trading session.
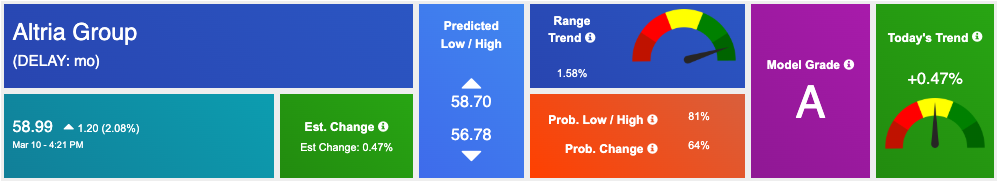
Our featured symbol for Tuesday is MO. Altria Group – MO is showing a steady vector in our Stock Forecast Toolbox’s 10-day forecast.
The symbol is trading at $58.99 with a vector of +0.47% at the time of publication.
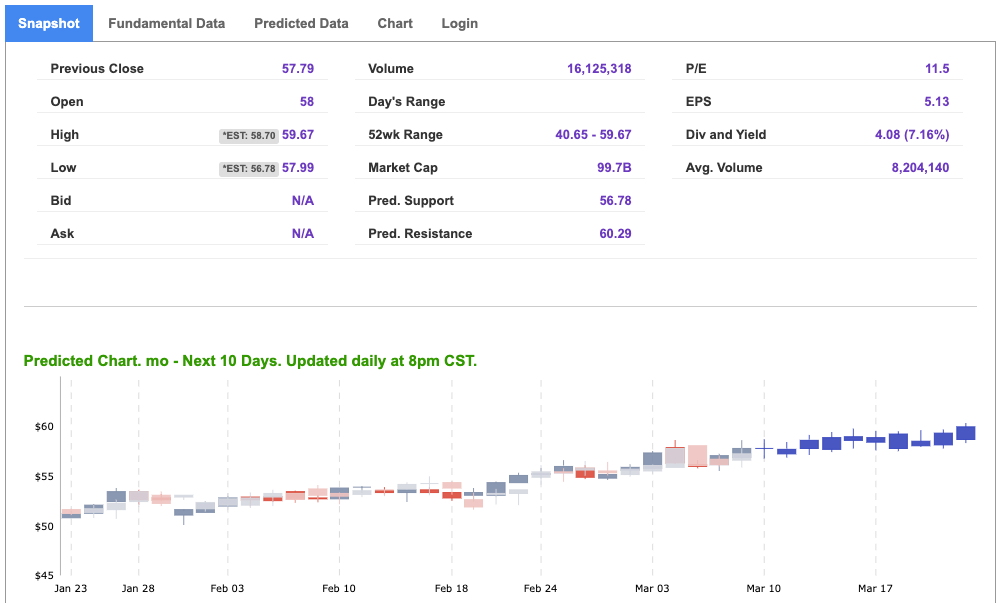
10-Day Prediction data is uploaded after the market close at 6 p.m., CST. Today’s data is based on market signals from the previous trading session.
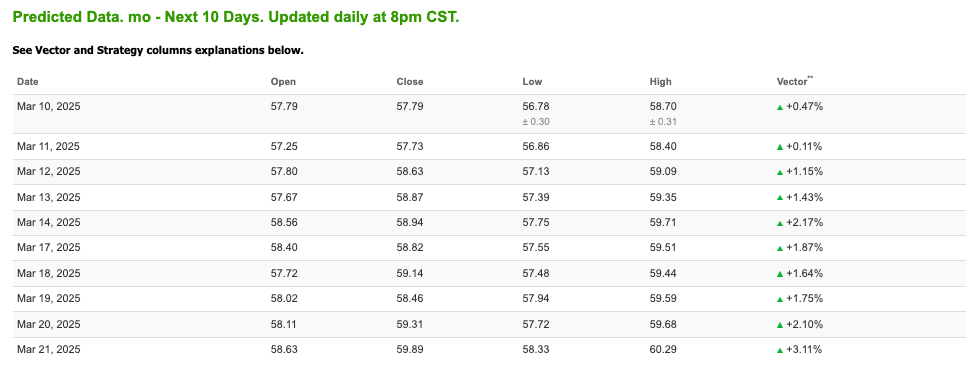
Note: The Vector column calculates the change of the Forecasted Average Price for the next trading session relative to the average of actual prices for the last trading session. The column shows the expected average price movement “Up or Down”, in percent. Trend traders should trade along the predicted direction of the Vector. The higher the value of the Vector the higher its momentum.
*Please note: At the time of publication Vlad Karpel does have a position in the featured symbol, mo. Our featured symbol is part of your free subscription service. It is not included in any paid Tradespoon subscription service. Vlad Karpel only trades his money in paid subscription services. If you are a paid subscriber, please review your Premium Member Picks, ActiveTrader, or MonthlyTrader recommendations. If you are interested in receiving Vlad’s picks, please click here.
West Texas Intermediate for Crude Oil delivery (CL.1) is priced at $65.91 per barrel, down 1.69%, at the time of publication.
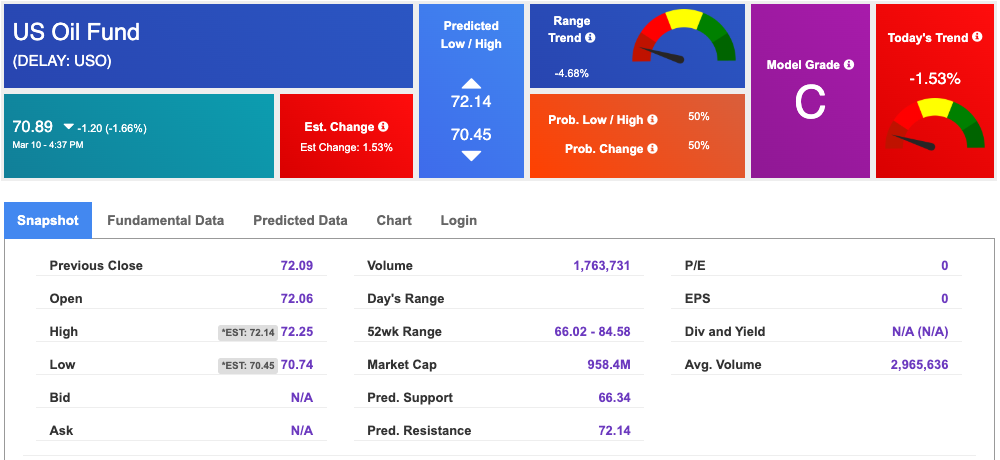
Looking at USO, a crude oil tracker, our 10-day prediction model shows mixed signals. The fund is trading at $70.89 at the time of publication. Prediction data is uploaded after the market close at 6 p.m., CST. Today’s data is based on market signals from the previous trading session.
The price for the Gold Continuous Contract (GC00) is down 0.72% at $2,893.20 at the time of publication.
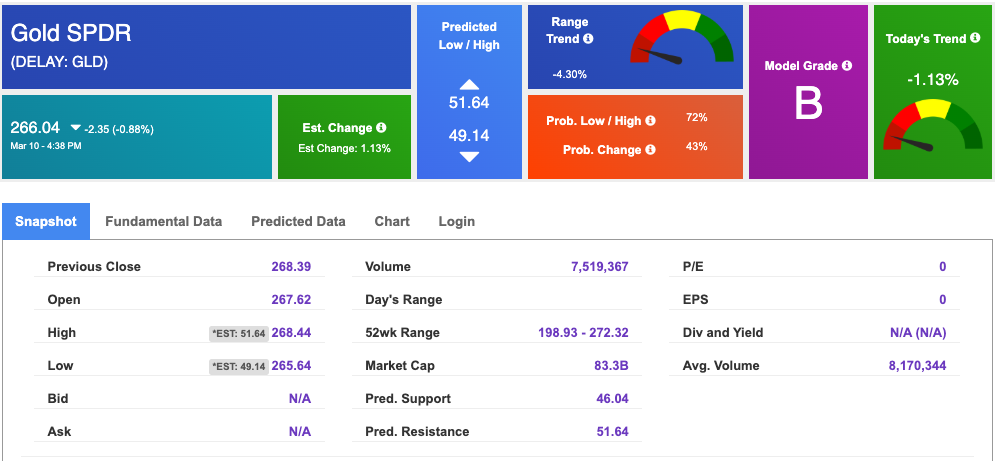
Using SPDR GOLD TRUST (GLD) as a tracker in our Stock Forecast Tool, the 10-day prediction window shows mixed signals. The gold proxy is trading at $266.04 at the time of publication. Vector signals show +1.13% for today. Prediction data is uploaded after the market close at 6 p.m., CST. Today’s data is based on market signals from the previous trading session.
The yield on the 10-year Treasury note is down at 4.216% at the time of publication.
The yield on the 30-year Treasury note is down at 4.544% at the time of publication.
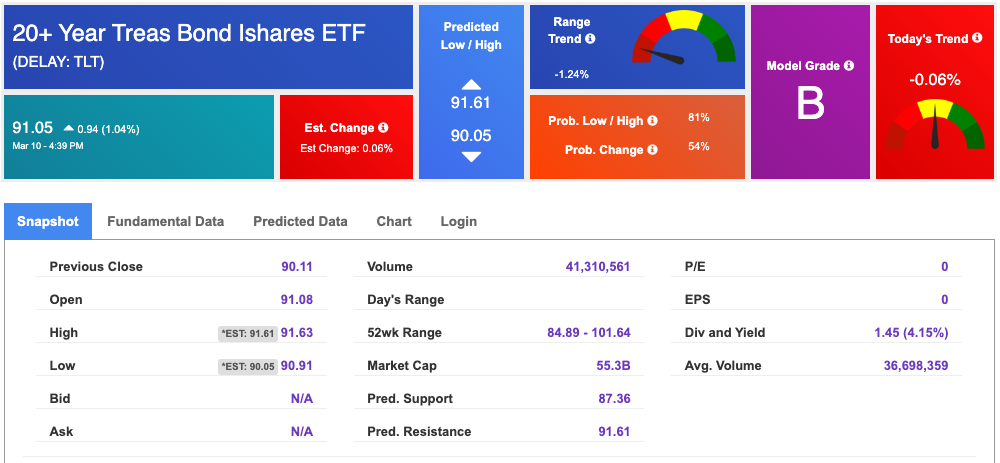
Using the iShares 20+ Year Treasury Bond ETF (TLT) as a proxy for bond prices in our Stock Forecast Tool, we see mixed signals in our 10-day prediction window. Prediction data is uploaded after the market close at 6 p.m., CST. Today’s data is based on market signals from the previous trading session.
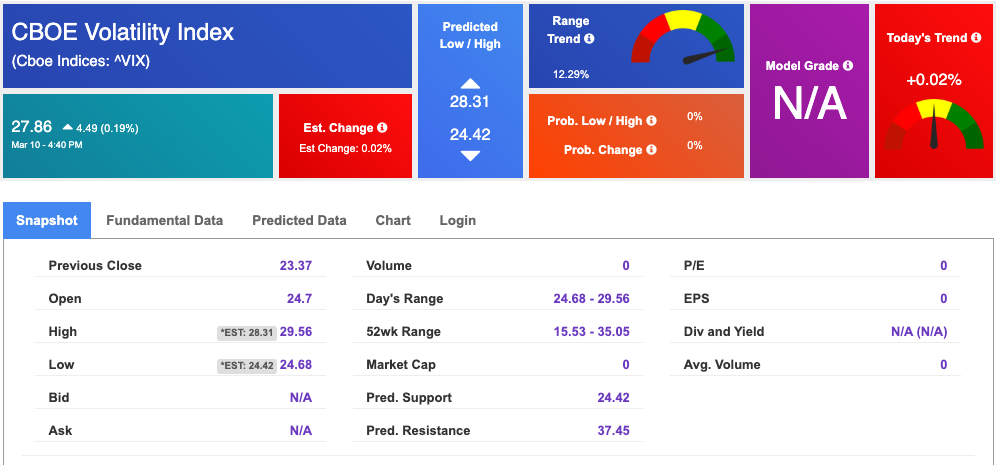
The CBOE Volatility Index (^VIX) is priced at $22.86 up -0.02% at the time of publication, and our 10-day prediction window shows mixed signals. Prediction data is uploaded after the market close at 6 p.m., CST. Today’s data is based on market signals from the previous trading session.
Please share this Tradespoon Market Commentary with your friends.
![]()

![]()
Comments Off on


Tradespoon Tools make finding winning trades in minute as easy as 1-2-3.
Our simple 3 step approach has resulted in an average return of almost 20% per trade!

