 Special Offer: Try the 'SpreadTrader Membership' for ONLY $37!
CLICK HERE TO LEARN MORE
Special Offer: Try the 'SpreadTrader Membership' for ONLY $37!
CLICK HERE TO LEARN MORE
At the forefront of market action was a renewed conflict between President Donald Trump and Federal Reserve Chairman Jerome Powell. President Trump’s public critiques of Powell, including repeated calls for his removal, added an extra layer of uncertainty to the already fragile market conditions. Trump’s attacks, particularly his assertion that Powell had acted too late in addressing economic challenges, sparked fears that the U.S. administration could attempt to intervene in the Fed’s decision-making. This uncertainty weighed heavily on investor sentiment, contributing to the sell-off in equities, bonds, and the dollar.
Last week, the financial markets experienced yet another turbulent stretch, heavily influenced by political pressures, inflation data, corporate earnings, and geopolitical risks. The market’s rollercoaster ride was fueled by a mix of trade tensions, mixed economic reports, and a spike in volatility driven by concerns over monetary policy and recession risks.
As the president continues to challenge Powell’s leadership, markets remain jittery, with concerns mounting over the potential for U.S. assets to lose their status as a global safe haven. The U.S. dollar, in particular, suffered a notable decline, falling over 1% and below $99, a reaction to Trump’s attacks on the Fed. This downturn in the dollar, paired with a sharp rise in gold prices, continues to highlight the growing uncertainty around U.S. monetary policy.
The ongoing U.S.-China trade tensions continued to play a significant role in market sentiment. While tariff exemptions for certain tech products, like smartphones and PCs, initially sparked a brief rebound, concerns resurfaced as semiconductor tariffs once again became a focal point. This re-escalation of tariff worries, combined with Jerome Powell’s warnings about the potential long-term inflationary impacts of these policies, sent major indices into sharp declines midweek. Powell highlighted that the tariffs could hinder job growth and push inflation higher, complicating the Federal Reserve’s already delicate balancing act of fostering economic stability.
In terms of inflation, the data presented mixed signals. The March Consumer Price Index (CPI) showed a slight easing, with a year-over-year increase of 2.4%—below expectations. However, core CPI, which excludes volatile food and energy prices, rose by 2.8%, indicating persistent price pressures. Meanwhile, the Producer Price Index (PPI) surprised to the downside, dropping 0.4%, suggesting some relief in producer-level inflation, though demand concerns lingered.
Amid the political and economic chaos, gold continued to shine as a safe-haven asset. Gold futures surged more than 3%, topping $3,400 per ounce, as investors flocked to the precious metal in search of stability. The rising gold prices reflect a growing sense of uncertainty in the market, particularly with the dollar’s decline and heightened concerns over future monetary policy shifts.
Corporate earnings presented a mixed picture. On one hand, Netflix delivered a strong earnings report, beating estimates and providing some optimism. However, the overall earnings season has been marked by cautious outlooks, especially from companies within the healthcare and financial sectors. UnitedHealth Group’s massive guidance revision sent shockwaves through the healthcare space, contributing to significant losses for the sector. Conversely, financial institutions like JPMorgan Chase and Bank of America reported strong earnings, providing some respite to the broader market.
As we head into the new week, all three major U.S. indices were trading lower, with heightened volatility continuing to shape the landscape. Trump’s attacks on the Fed and the ongoing tariff drama have kept the market on edge. The S&P 500, Nasdaq, and Dow all traded lower, reflecting the broader market’s risk-off sentiment. The Cboe Volatility Index (VIX), a measure of market fear, surged to more than 32, signaling that volatility is likely to persist.
Economic data due this week will likely continue to influence market behavior. Key reports include the Fed’s Beige Book, along with services and manufacturing PMI, new home sales, and U.S. leading economic indicators. These reports will provide critical insights into the state of the economy, particularly in light of increasing recession risks and rising unemployment.
On the earnings front, several high-profile companies are set to report, including Google, 3M, General Electric, Northrop Grumman, and Tesla, among others. These earnings will be closely scrutinized for any signs of stress in corporate fundamentals, especially as recession probabilities rise.
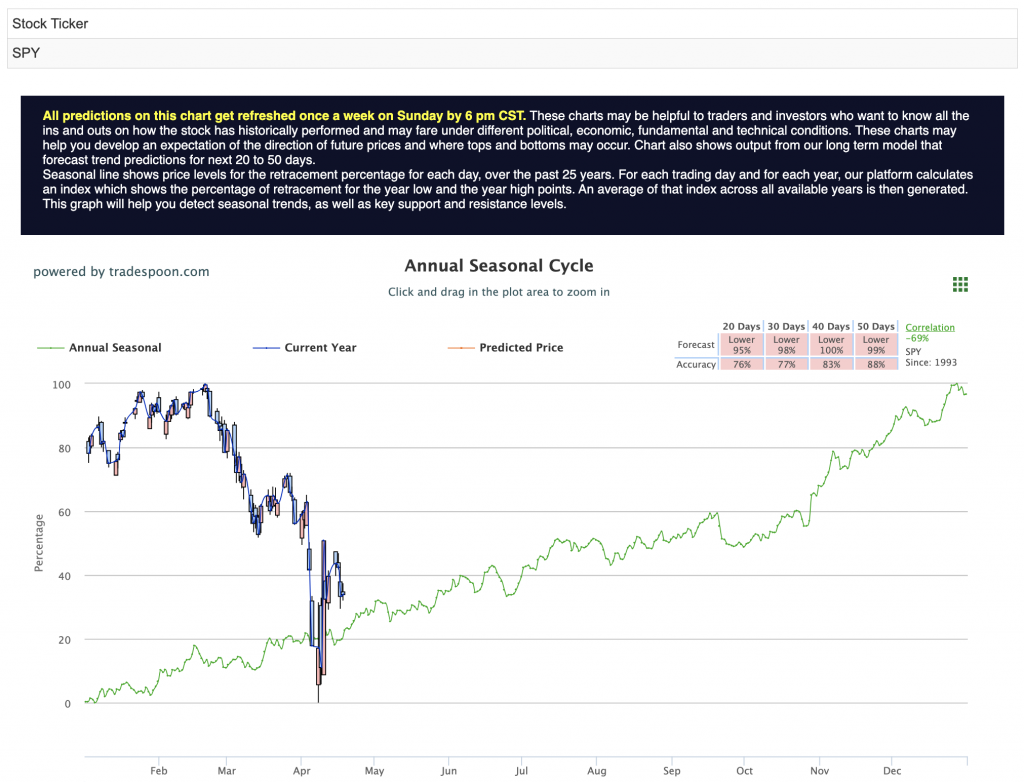
With recession risks climbing and the Fed’s interest rate policies remaining in focus, I’m adopting a market-neutral stance. The downside remains the dominant theme in the short-term, as recession odds increase and concerns over high inflation persist. The market’s short-term support levels for the SPY are between $500 and $530, while the rally could face resistance in the $500–580 range. However, the long-term trend remains under pressure, as concerns over rising unemployment, ongoing tariff impacts, and Fed policy continue to weigh heavily on investor sentiment. For reference, the SPY Seasonal Chart is shown below:
The market continues to grapple with a mix of political uncertainty, inflationary pressures, and fears of a potential recession. As the U.S. dollar weakens and safe-haven assets like gold gain favor, investors are navigating a volatile landscape. While short-term rallies may offer temporary respite, the overarching trend points to continued caution in the face of macroeconomic headwinds. With the risk of higher interest rates for longer and an uncertain economic trajectory, the market remains highly sensitive to developments in monetary policy, tariffs, and geopolitical events.
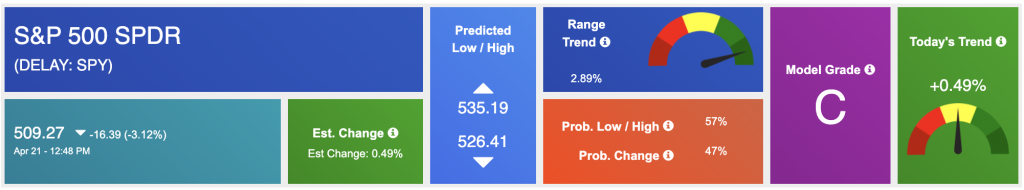
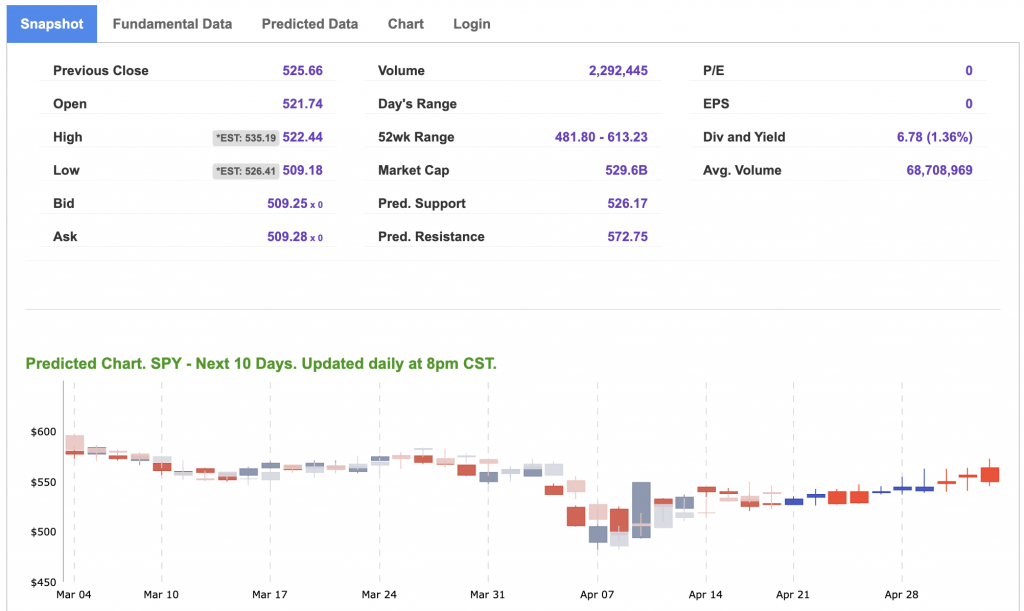
Using the “SPY” symbol to analyze the S&P 500 our 10-day prediction window shows a near-term positive outlook. Prediction data is uploaded after the market closes at 6 p.m. CST. Today’s data is based on market signals from the previous trading session.
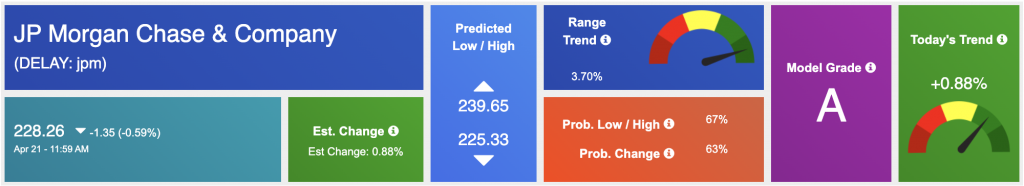
Our featured symbol for Tuesday is JPM. JP Morgan Chase – JPM is showing a steady vector in our Stock Forecast Toolbox’s 10-day forecast.
The symbol is trading at $228.26 with a vector of +0.88% at the time of publication.
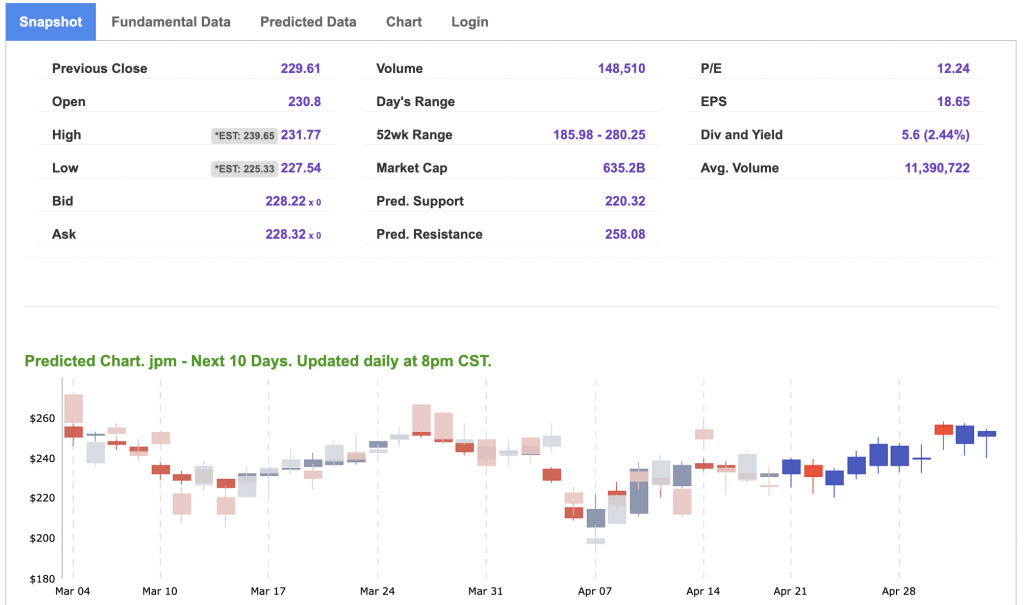
10-Day Prediction data is uploaded after the market close at 6 p.m., CST. Today’s data is based on market signals from the previous trading session.
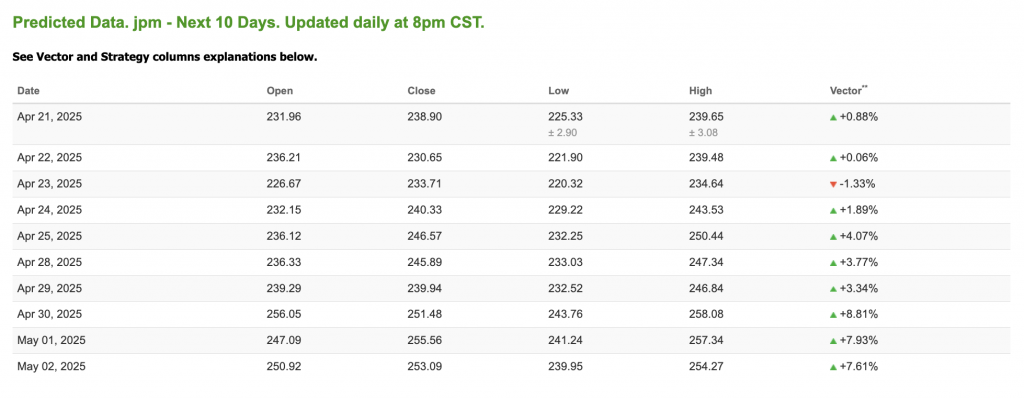
Note: The Vector column calculates the change of the Forecasted Average Price for the next trading session relative to the average of actual prices for the last trading session. The column shows the expected average price movement “Up or Down”, in percent. Trend traders should trade along the predicted direction of the Vector. The higher the value of the Vector the higher its momentum.
*Please note: At the time of publication Vlad Karpel does have a position in the featured symbol, JPM. Our featured symbol is part of your free subscription service. It is not included in any paid Tradespoon subscription service. Vlad Karpel only trades his money in paid subscription services. If you are a paid subscriber, please review your Premium Member Picks, ActiveTrader, or MonthlyTrader recommendations. If you are interested in receiving Vlad’s picks, please click here.
West Texas Intermediate for Crude Oil delivery (CL.1) is priced at $63.15 per barrel, down 2.20%, at the time of publication.
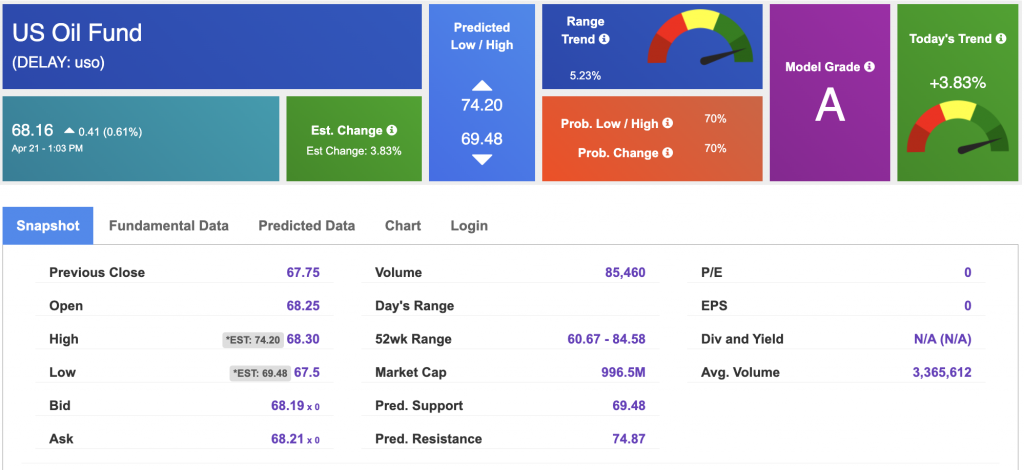
Looking at USO, a crude oil tracker, our 10-day prediction model shows mixed signals. The fund is trading at $68.16 at the time of publication. Prediction data is uploaded after the market close at 6 p.m., CST. Today’s data is based on market signals from the previous trading session.
The price for the Gold Continuous Contract (GC00) is up 3.23% at $3,435.80 at the time of publication.
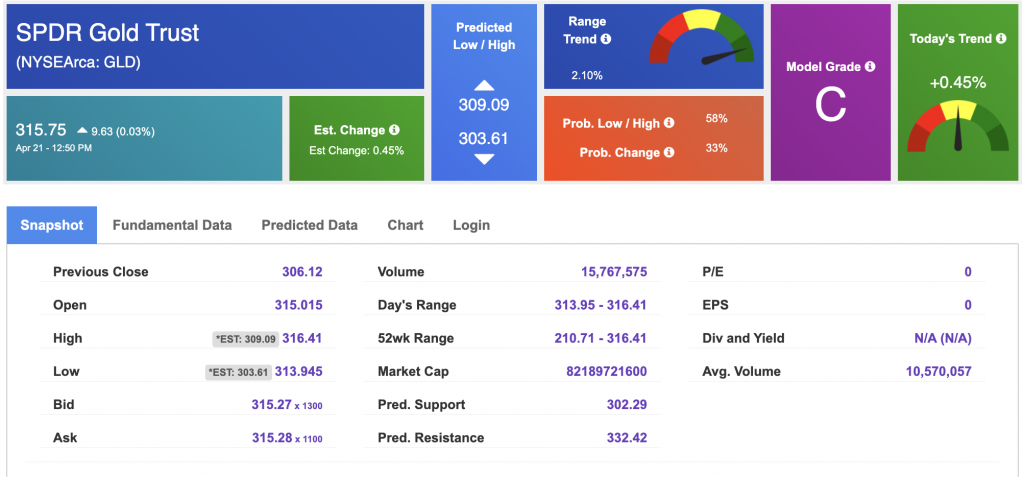
Using SPDR GOLD TRUST (GLD) as a tracker in our Stock Forecast Tool, the 10-day prediction window shows mixed signals. The gold proxy is trading at $315.75 at the time of publication. Vector signals show +0.45% for today. Prediction data is uploaded after the market close at 6 p.m., CST. Today’s data is based on market signals from the previous trading session.
The yield on the 10-year Treasury note is up at 4.396% at the time of publication.
The yield on the 30-year Treasury note is up at 4.899% at the time of publication.
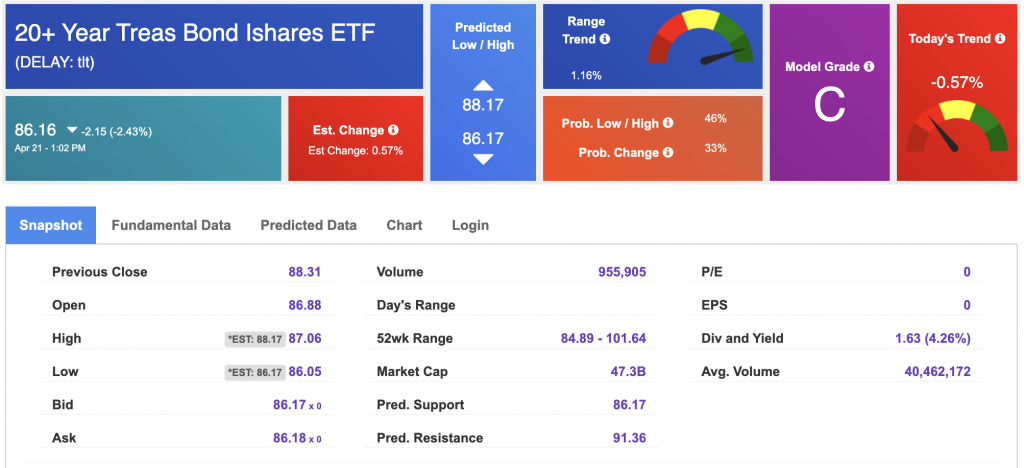
Using the iShares 20+ Year Treasury Bond ETF (TLT) as a proxy for bond prices in our Stock Forecast Tool, we see mixed signals in our 10-day prediction window. Prediction data is uploaded after the market close at 6 p.m., CST. Today’s data is based on market signals from the previous trading session.
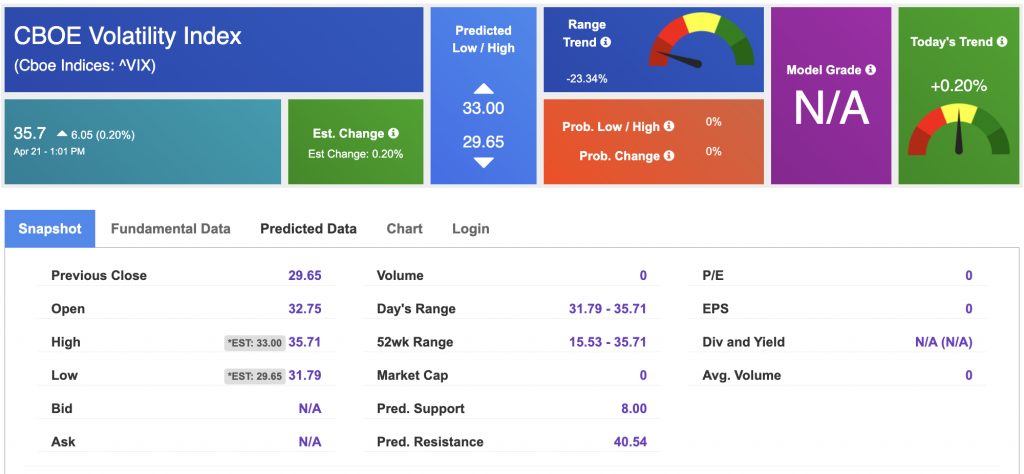
The CBOE Volatility Index (^VIX) is priced at $35.7 at the time of publication, and our 10-day prediction window shows mixed signals. Prediction data is uploaded after the market close at 6 p.m., CST. Today’s data is based on market signals from the previous trading session.
Please share this Tradespoon Market Commentary with your friends.
![]()

![]()
Comments Off on


Tradespoon Tools make finding winning trades in minute as easy as 1-2-3.
Our simple 3 step approach has resulted in an average return of almost 20% per trade!

