 Limited Time Offer: Get Instant Access to the 'Elite' Trading Circle! (Monthly Plan Available)
CLICK HERE TO LEARN MORE
Limited Time Offer: Get Instant Access to the 'Elite' Trading Circle! (Monthly Plan Available)
CLICK HERE TO LEARN MORE
This week, the Nasdaq and S&P 500 saw modest gains as investors geared up for a flurry of tech earnings reports. Meanwhile, the Dow Jones lagged, underscoring a divergence in market performance. Wall Street is bracing for a pivotal week marked by major corporate earnings and a crucial Federal Reserve interest rate decision. Recent positive inflation data has fueled optimism that the Fed might soon lower interest rates, potentially providing a boost to stocks by easing borrowing costs for companies.
The spotlight this week is on major earnings announcements from tech behemoths Amazon, Apple, Meta Platforms, and Microsoft. The semiconductor sector led the S&P 500, buoyed by better-than-expected second-quarter results, signaling robust demand within the tech industry. Despite this, Nvidia’s shares slipped as investors remain cautious ahead of its earnings report later in August, adding a layer of uncertainty to an otherwise bullish tech narrative.
Technology stocks have been the driving force behind recent gains in the S&P 500 and Nasdaq. However, with several critical earnings reports looming, market participants are eager to see whether demand for AI chips and other tech innovations can sustain the current momentum. The Nasdaq Composite experienced some volatility as Nvidia’s decline created ripples across tech stocks, highlighting the sector’s sensitivity to earnings outcomes.
Oil futures reversed overnight gains due to ongoing concerns about weak demand from China, which overshadowed rising geopolitical tensions in the Middle East. Meanwhile, bond yields exhibited significant volatility, with the 10-year U.S. Treasury yield fluctuating between 4.2% and 4.7%. The 10-year yield recently retested the 4.3% level, while the 2-year yield fell below the 30-year yield for the first time in two years, suggesting potential shifts in economic expectations.
The CBOE Volatility Index, commonly known as the market’s fear gauge, jumped to 17.09, reflecting heightened investor anxiety amid mixed signals. Over the past year, the index has oscillated between 10.62 and 23.08, capturing the market’s shifting sentiment and risk appetite.
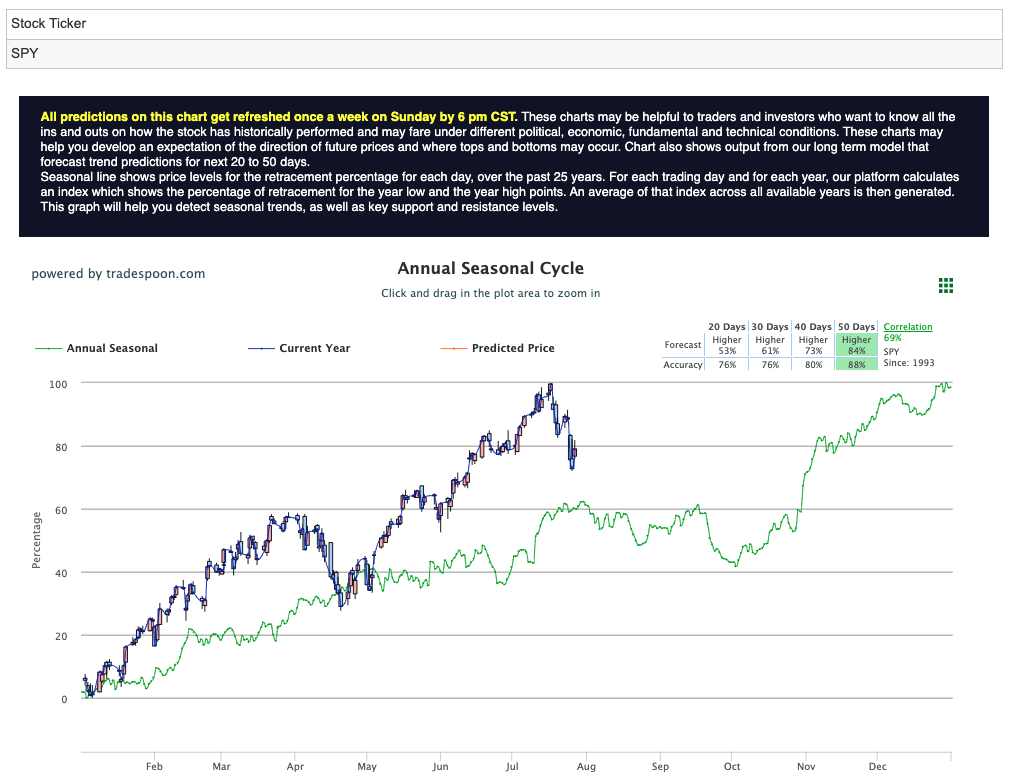
Amid the current market volatility and mixed economic indicators, adopting a market-neutral stance seems wise as we navigate one of the most critical weeks of this earnings season. The SPDR S&P 500 ETF Trust ($SPY) faces resistance between $560 and $575, with short-term support anticipated between $520 and $530. The technical outlook suggests a sideways trading pattern in the short to medium term. While the long-term trend remains positive, the current volatility and mixed economic signals call for a cautious approach. For reference, the SPY Seasonal Chart is shown below:
Several key events this week could significantly influence market dynamics. The Job Openings and Labor Turnover Survey will provide crucial insights into the health of the labor market. Meanwhile, the Bank of Japan meeting could introduce new dynamics to the global economic landscape. The Federal Open Market Committee’s meeting on July 30 to July 31 is highly anticipated, with any comments from central bank officials regarding a potential September interest-rate cut likely to sway market sentiment. The week will conclude with Friday’s jobs report, a critical data point for investors trying to predict the Fed’s next move.
In summary, as we embark on a week filled with significant economic and corporate events, maintaining a balanced and cautious perspective is essential. While opportunities exist, the interplay between tech earnings, interest rates, and global economic factors will ultimately dictate the market’s trajectory in the coming weeks.
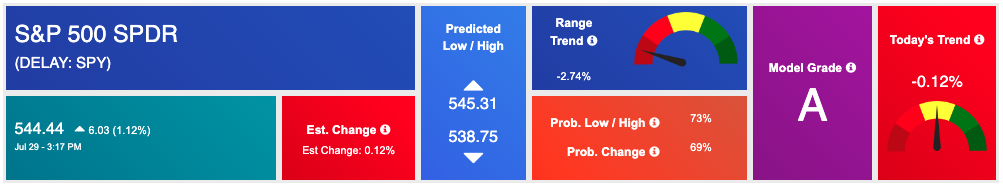
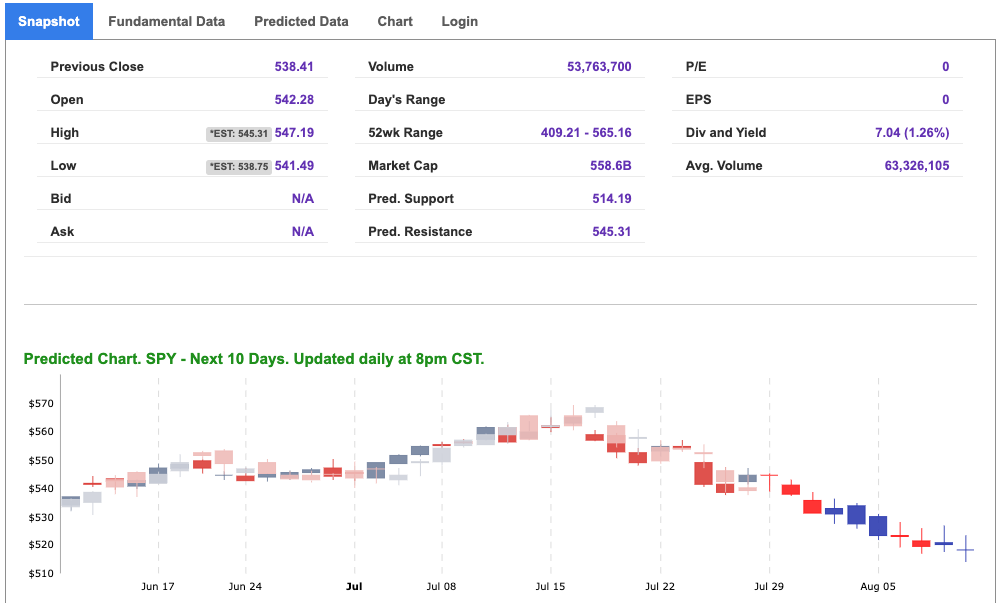
Using the “SPY” symbol to analyze the S&P 500 our 10-day prediction window shows a near-term positive outlook. Prediction data is uploaded after the market closes at 6 p.m. CST. Today’s data is based on market signals from the previous trading session.
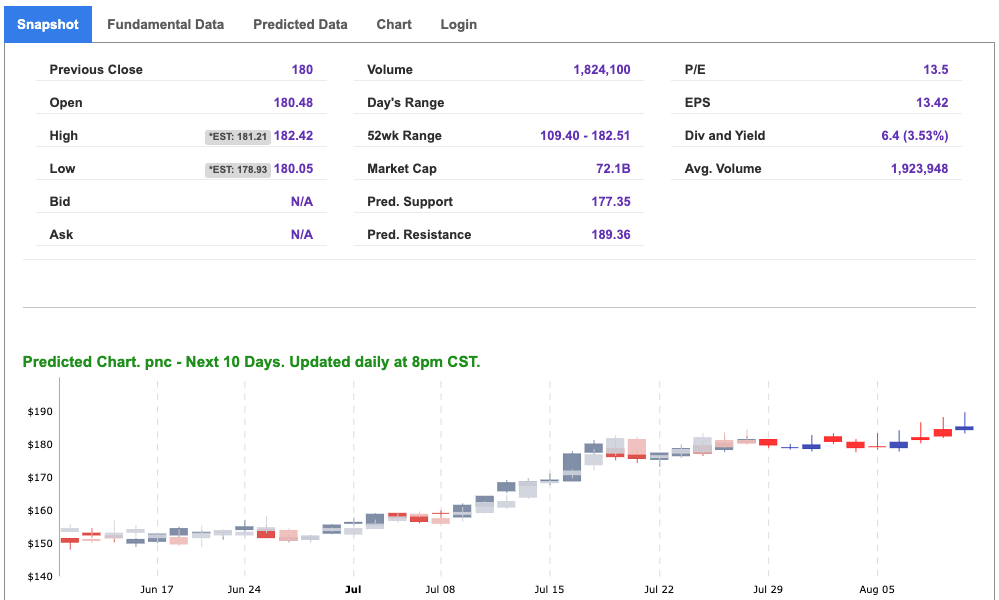
Note: The Vector column calculates the change of the Forecasted Average Price for the next trading session relative to the average of actual prices for the last trading session. The column shows the expected average price movement “Up or Down”, in percent. Trend traders should trade along the predicted direction of the Vector. The higher the value of the Vector the higher its momentum.
*Please note: At the time of publication Vlad Karpel does have a position in the featured symbol, jpm. Our featured symbol is part of your free subscription service. It is not included in any paid Tradespoon subscription service. Vlad Karpel only trades his money in paid subscription services. If you are a paid subscriber, please review your Premium Member Picks, ActiveTrader, or MonthlyTrader recommendations. If you are interested in receiving Vlad’s picks, please click here.
West Texas Intermediate for Crude Oil delivery (CL.1) is priced at $75.89 per barrel, down 1.61%, at the time of publication.
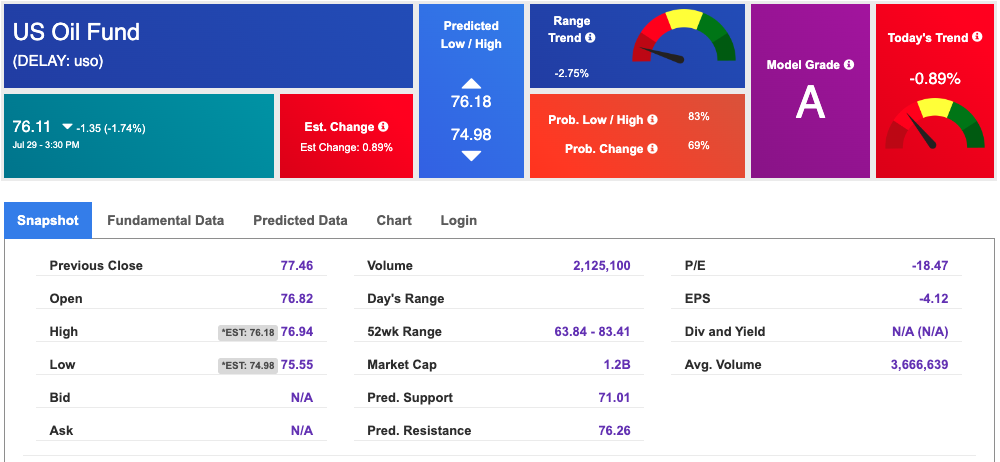
Looking at USO, a crude oil tracker, our 10-day prediction model shows mixed signals. The fund is trading at $76.11 at the time of publication. Prediction data is uploaded after the market close at 6 p.m., CST. Today’s data is based on market signals from the previous trading session.
The price for the Gold Continuous Contract (GC00) is down 0.08% at $2379.20 at the time of publication.
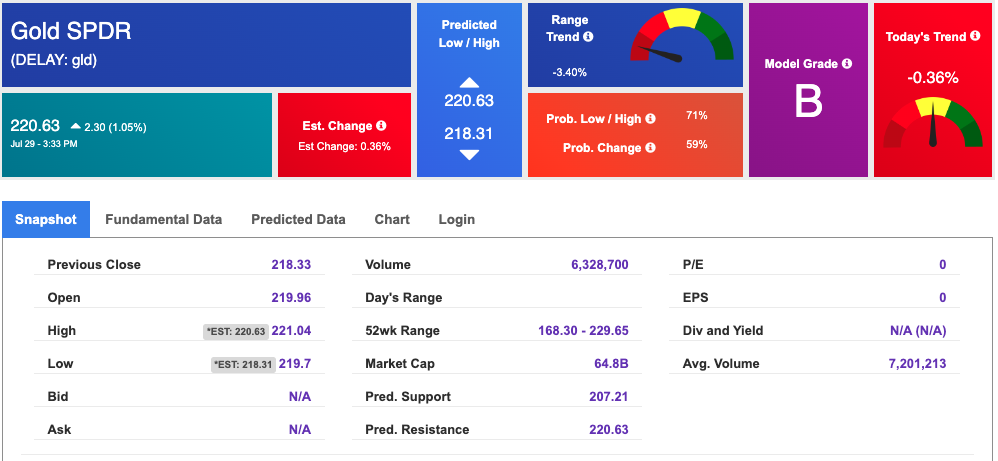
Using SPDR GOLD TRUST (GLD) as a tracker in our Stock Forecast Tool, the 10-day prediction window shows mixed signals. The gold proxy is trading at $220.63 at the time of publication. Vector signals show -0.36% for today. Prediction data is uploaded after the market close at 6 p.m., CST. Today’s data is based on market signals from the previous trading session.
The yield on the 10-year Treasury note is down at 4.178% at the time of publication.
The yield on the 30-year Treasury note is down at 4.425% at the time of publication.
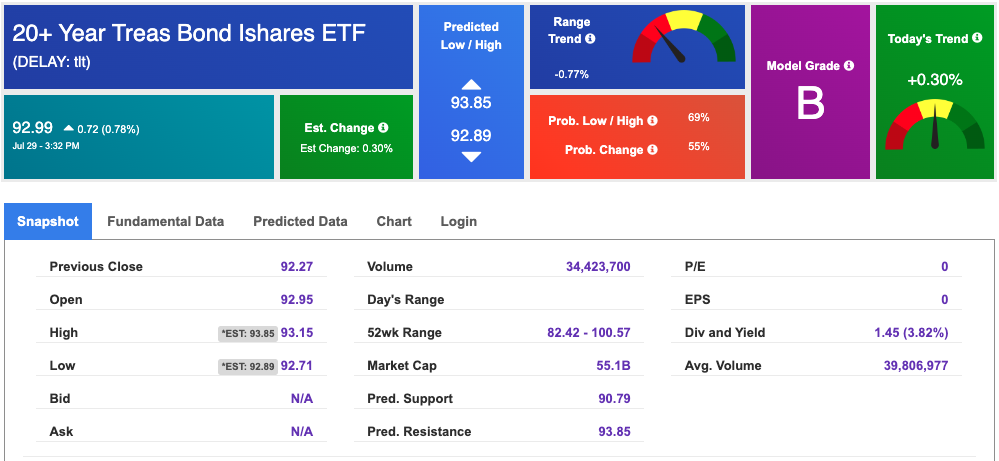
Using the iShares 20+ Year Treasury Bond ETF (TLT) as a proxy for bond prices in our Stock Forecast Tool, we see mixed signals in our 10-day prediction window. Prediction data is uploaded after the market close at 6 p.m., CST. Today’s data is based on market signals from the previous trading session.
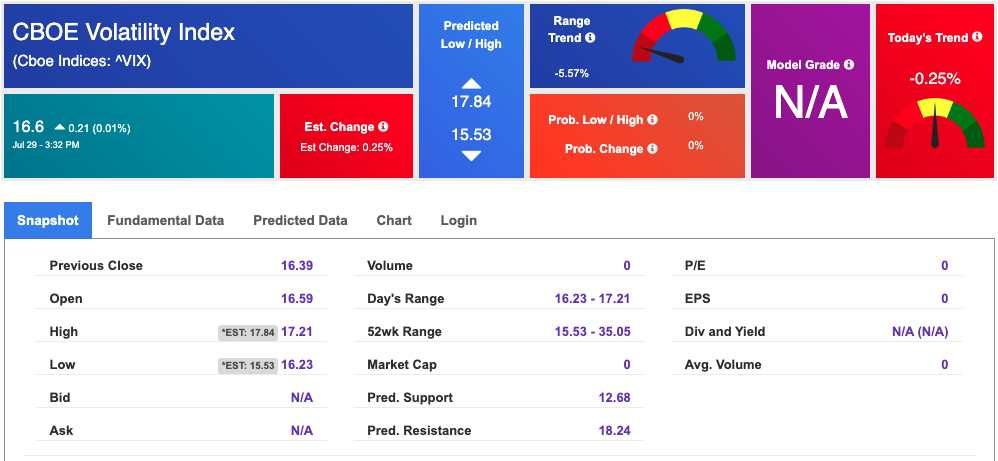
The CBOE Volatility Index (^VIX) is priced at $16.6 up 0.01% at the time of publication, and our 10-day prediction window shows mixed signals. Prediction data is uploaded after the market close at 6 p.m., CST. Today’s data is based on market signals from the previous trading session.
Please share this Tradespoon Market Commentary with your friends.
![]()

![]()
Comments Off on


Tradespoon Tools make finding winning trades in minute as easy as 1-2-3.
Our simple 3 step approach has resulted in an average return of almost 20% per trade!

