 Special Offer: Get a 'Standalone' WeeklyTrader Membership for much less than the cost of the entire Elite Membership!
CLICK HERE TO LEARN MORE
Special Offer: Get a 'Standalone' WeeklyTrader Membership for much less than the cost of the entire Elite Membership!
CLICK HERE TO LEARN MORE
The stock market began this week with heightened volatility, as tariffs continued to loom large in investors’ minds, exacerbating an already unpredictable economic landscape. The VIX, a key gauge of market fear, spiked to a staggering 50, reflecting the intense uncertainty that has gripped Wall Street. Investors are awaiting critical updates on President Donald Trump’s tariff strategy, with the president recently threatening to impose an additional 50% tariff on China if the country moves forward with its own retaliatory tariffs of 34%. However, these tensions are not limited to China alone—other nations are expected to engage in discussions with the president, potentially influencing the global economic outlook.
On Monday, the markets were rocked by an initial sell-off across all three major U.S. indices, which closed the day in the red. However, there was a brief reprieve mid-day when an erroneous report circulated suggesting that President Trump might halt the tariffs. This triggered a temporary market rally, only for the White House to clarify that there were no intentions to pause the tariffs. This clarification sent markets back into a tailspin, underscoring the fragile sentiment in the current market environment.
As the week unfolds, investors will be watching several key events that could shape the future direction of the markets. A series of speeches from Federal Reserve officials will take place, with particular attention on Thursday’s release of the Consumer Price Index (CPI) data and the Federal Budget. On Friday, the Producer Price Index (PPI) will provide further insight into inflationary pressures. Additionally, the earnings season kicks into full gear with several high-profile companies reporting, including Delta Air Lines, Constellation Brands, CarMax, and the major banks, including JPMorgan Chase, Morgan Stanley, and Wells Fargo, all scheduled for Friday.
The current economic backdrop has investors on edge, grappling with a complex mix of rising inflation, increasing bond yields, and a labor market that continues to show resilience. The Federal Reserve’s path forward has become more uncertain, and any unexpected developments, such as new tariffs, add layers of complexity to an already tense situation. Last week, the market entered the new quarter under pressure, with hopes for a soft economic landing fading as the threat of further geopolitical disruptions—especially in the realm of global trade—took center stage.
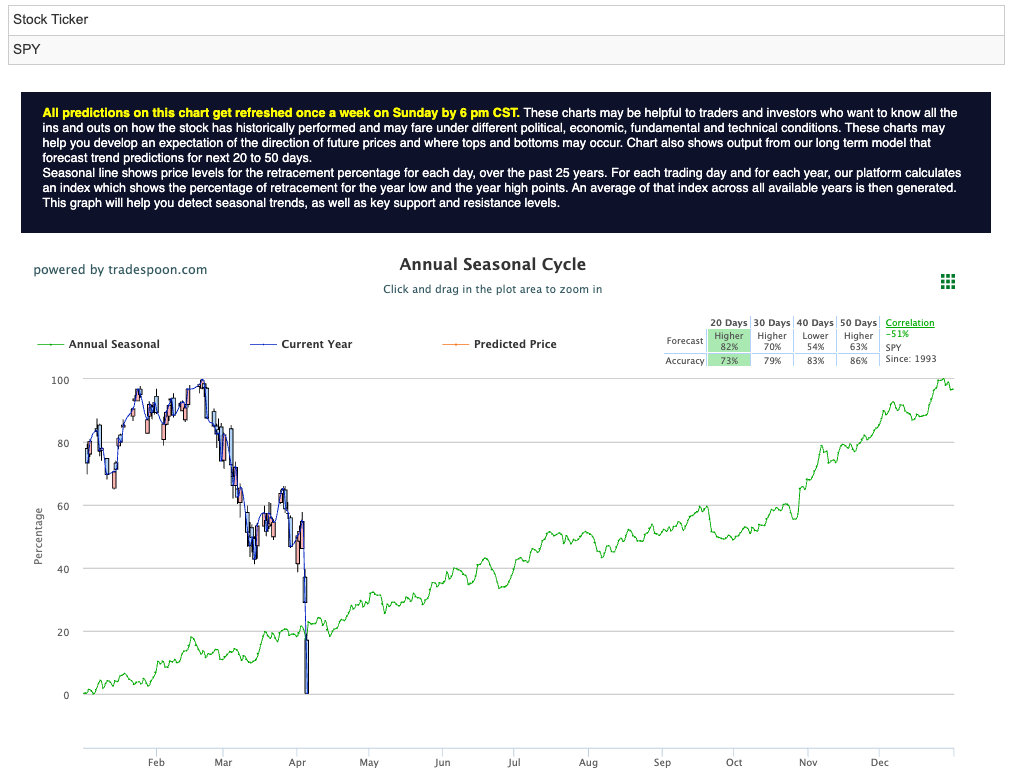
The fear surrounding President Trump’s tariff rhetoric is compounded by persistent inflation and the Federal Reserve’s ongoing efforts to tame it, which is only adding fuel to the fire. Investors are now trying to gauge how the central bank will navigate these inflationary pressures while managing the growing risk of geopolitical instability. As of now, the SPY appears to be range-bound, with resistance levels in the $500–$520 zone and immediate support sitting between $480 and $500. For reference, the SPY Seasonal Chart is shown below:
The first week of Q2 2025 marked a significant shift in investor sentiment, as the S&P 500 and Nasdaq Composite both ended their five-quarter winning streaks. A mix of unsettling developments—including former President Trump’s surprise tariff announcement and stronger-than-expected labor market data—added to the market’s woes. These factors dashed expectations of near-term Federal Reserve rate cuts and triggered severe quarterly losses. The resulting climate of heightened volatility has left investors on edge, uncertain of where the market is headed next.
In conclusion, the road ahead looks uncertain, with inflationary pressures, rising bond yields, and geopolitical risks weighing heavily on market sentiment. The Federal Reserve’s response to these pressures and the ongoing tariff saga will be pivotal in shaping the trajectory of the market in the coming weeks. With earnings season in full swing, all eyes will be on key economic data and the Federal Reserve’s next moves as investors brace for potential volatility.
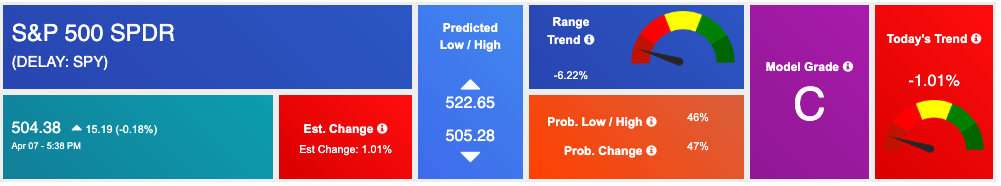
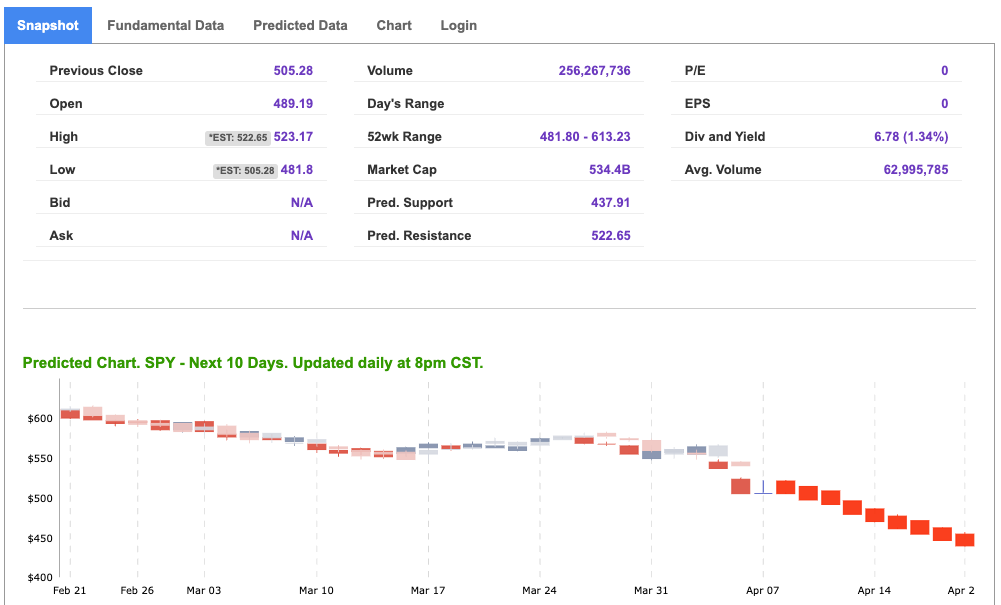
Using the “SPY” symbol to analyze the S&P 500 our 10-day prediction window shows a near-term positive outlook. Prediction data is uploaded after the market closes at 6 p.m. CST. Today’s data is based on market signals from the previous trading session.
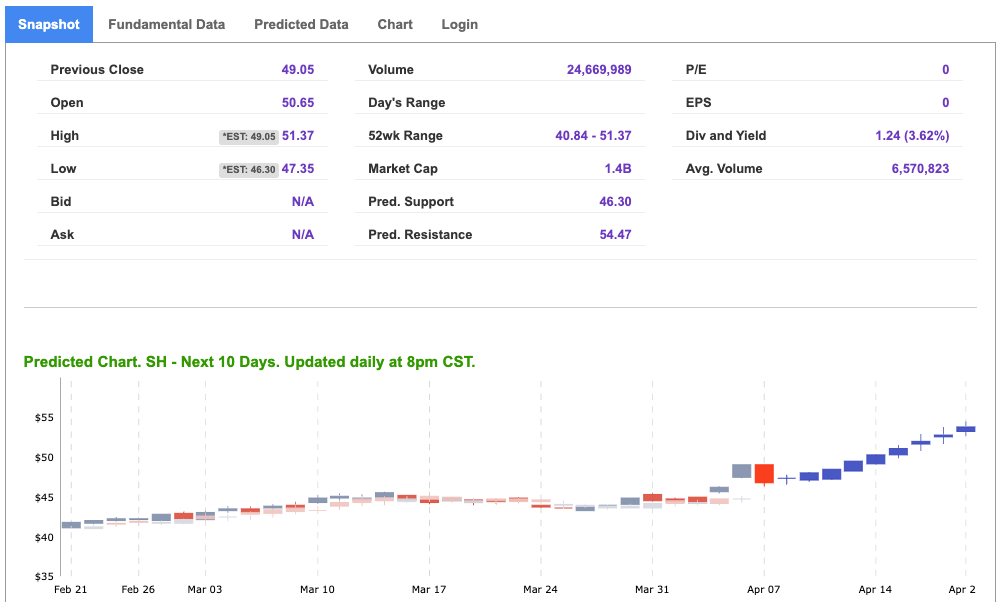
Our featured symbol for Tuesday is SH. Short S&P 500 ETF – SH is showing a steady vector in our Stock Forecast Toolbox’s 10-day forecast.
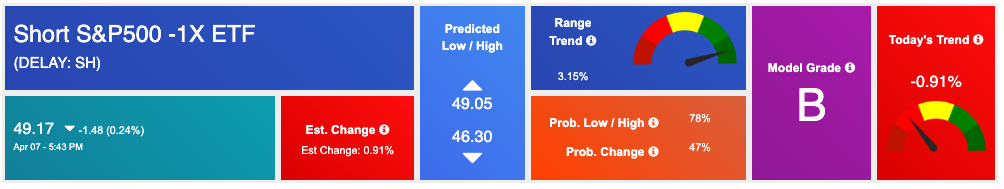
The symbol is trading at $49.17 with a vector of -0.91% at the time of publication.
10-Day Prediction data is uploaded after the market close at 6 p.m., CST. Today’s data is based on market signals from the previous trading session.
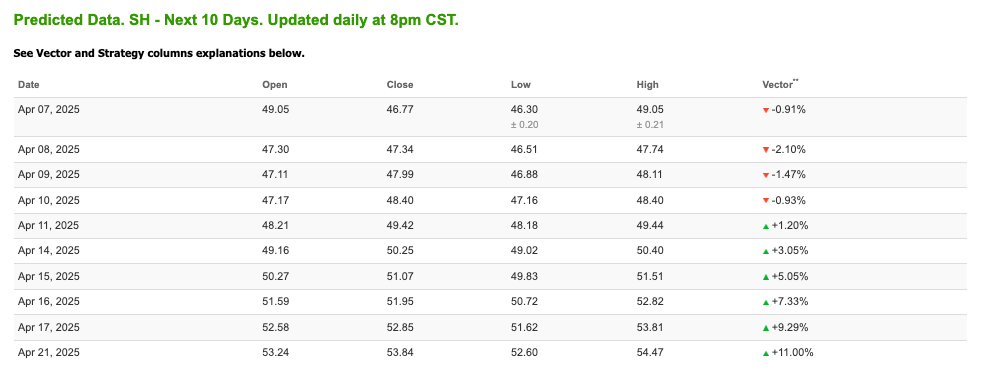
Note: The Vector column calculates the change of the Forecasted Average Price for the next trading session relative to the average of actual prices for the last trading session. The column shows the expected average price movement “Up or Down”, in percent. Trend traders should trade along the predicted direction of the Vector. The higher the value of the Vector the higher its momentum.
*Please note: At the time of publication Vlad Karpel does have a position in the featured symbol, SH. Our featured symbol is part of your free subscription service. It is not included in any paid Tradespoon subscription service. Vlad Karpel only trades his money in paid subscription services. If you are a paid subscriber, please review your Premium Member Picks, ActiveTrader, or MonthlyTrader recommendations. If you are interested in receiving Vlad’s picks, please click here.
West Texas Intermediate for Crude Oil delivery (CL.1) is priced at $61.30 per barrel, up 0.99%, at the time of publication.
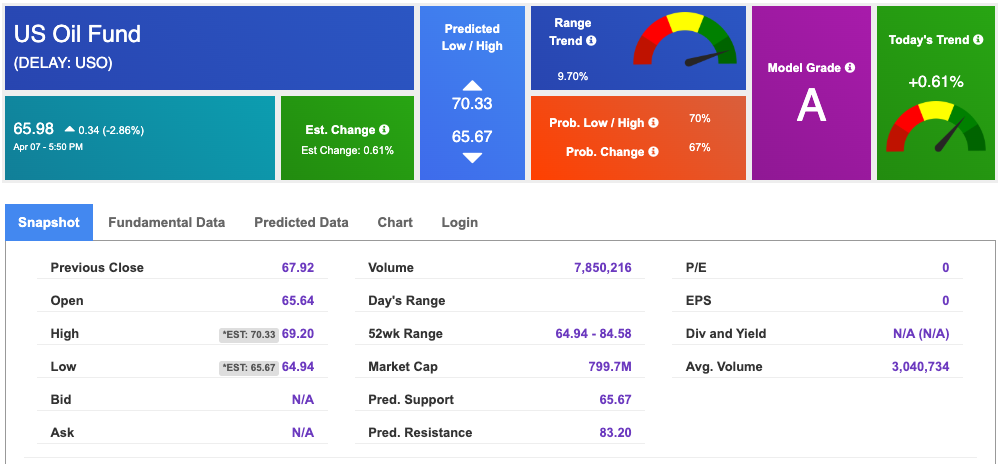
Looking at USO, a crude oil tracker, our 10-day prediction model shows mixed signals. The fund is trading at $65.98 at the time of publication. Prediction data is uploaded after the market close at 6 p.m., CST. Today’s data is based on market signals from the previous trading session.
The price for the Gold Continuous Contract (GC00) is up 0.96% at $3,001.60 at the time of publication.
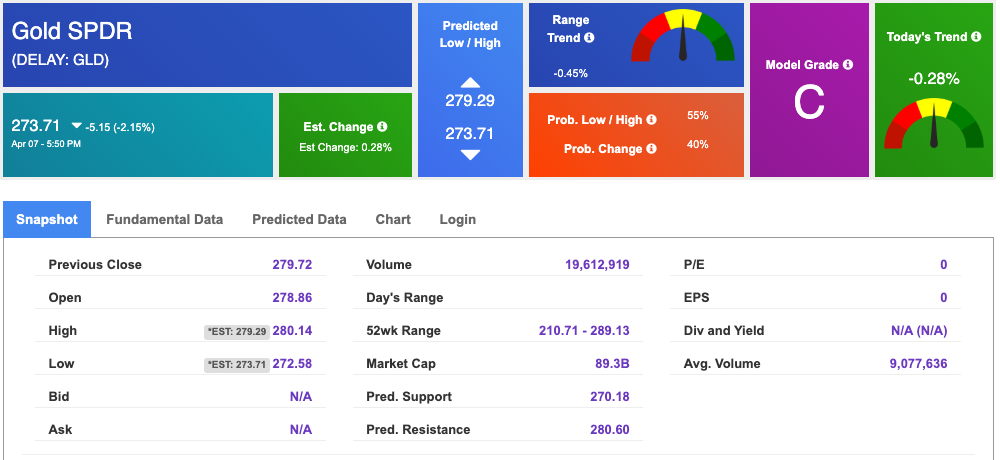
Using SPDR GOLD TRUST (GLD) as a tracker in our Stock Forecast Tool, the 10-day prediction window shows mixed signals. The gold proxy is trading at $273.71 at the time of publication. Vector signals show +0.28% for today. Prediction data is uploaded after the market close at 6 p.m., CST. Today’s data is based on market signals from the previous trading session.
The yield on the 10-year Treasury note is down at 4.177% at the time of publication.
The yield on the 30-year Treasury note is down at 4.624% at the time of publication.
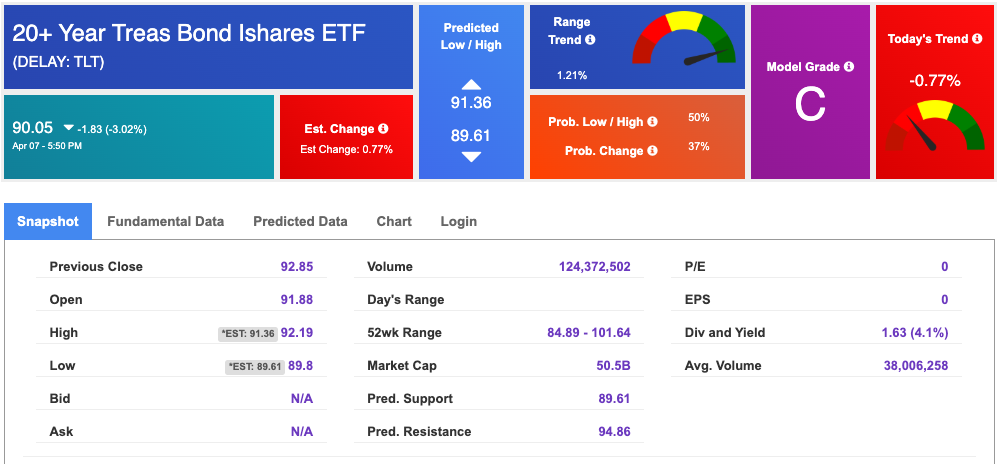
Using the iShares 20+ Year Treasury Bond ETF (TLT) as a proxy for bond prices in our Stock Forecast Tool, we see mixed signals in our 10-day prediction window. Prediction data is uploaded after the market close at 6 p.m., CST. Today’s data is based on market signals from the previous trading session.
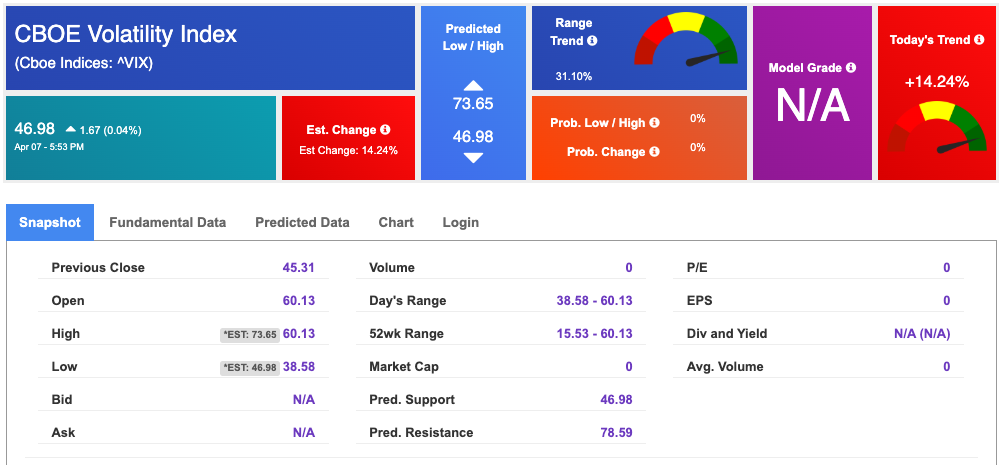
The CBOE Volatility Index (^VIX) is priced at $46.9 at the time of publication, and our 10-day prediction window shows mixed signals. Prediction data is uploaded after the market close at 6 p.m., CST. Today’s data is based on market signals from the previous trading session.
Please share this Tradespoon Market Commentary with your friends.
![]()

![]()
Comments Off on


Tradespoon Tools make finding winning trades in minute as easy as 1-2-3.
Our simple 3 step approach has resulted in an average return of almost 20% per trade!

