Today, the stock markets experienced a mixed trading session, with the Nasdaq and S&P closing in positive territory, while the Dow ended in the red. The upcoming earnings releases of prominent companies such as DIS, WDC, and PYPL, alongside crucial CPI/PPI data, are expected to influence the market’s next move. Despite talk of a potential recession, stock prices remained largely unchanged on Monday, as traders brace themselves for significant economic indicators later in the week. Among these indicators, April’s consumer price index, set to be released on Wednesday morning, will take the spotlight. Economists predict a 5% year-over-year gain, maintaining the same level as May’s previous result. Market participants hope for lower inflation figures, as it would reinforce the belief that the Federal Reserve has ceased hiking interest rates, a strategy aimed at curbing inflation by dampening economic demand.
Inflation figures are expected to hold steady as consumer prices are anticipated to have risen by 5% in April, according to the forthcoming inflation data set to be unveiled on Wednesday morning. This reading would mirror March’s figure, yet it marks a substantial decrease compared to last year’s peak of just over 9%. Such a development would reinforce market expectations that the Federal Reserve’s interest rate hikes are unnecessary to combat inflation, as they primarily aim to reduce economic demand. The Labor Department’s report on Friday revealed that the U.S. economy generated 253,000 jobs in April, surpassing expectations and demonstrating the resilience of the labor market amidst increasing interest rates and high inflation. This surprising jump from March’s figures underscores the ongoing strength of the job market.
Meanwhile, the unresolved dispute surrounding the debt ceiling continues to be a cause for concern. A potential U.S. default on its debt would result in lower Treasury bond prices and higher yields. This scenario poses a funding risk for the government and increases the overall riskiness of other financial assets such as corporate bonds and stocks. In an effort to address this matter, President Joe Biden will engage in discussions with Republican leaders on Tuesday to initiate talks on the debt ceiling.
As stock markets conclude a mixed trading day, investors eagerly await the release of key earnings reports and vital inflation data. The upcoming announcements hold the potential to shape market sentiment and influence investment decisions. All eyes are on the consumer price index figures, with hopes of lower inflationary pressures, thus supporting the narrative that the Federal Reserve has no immediate plans for further interest rate hikes. Globally, Asian markets finished in the green while European markets saw mixed results.
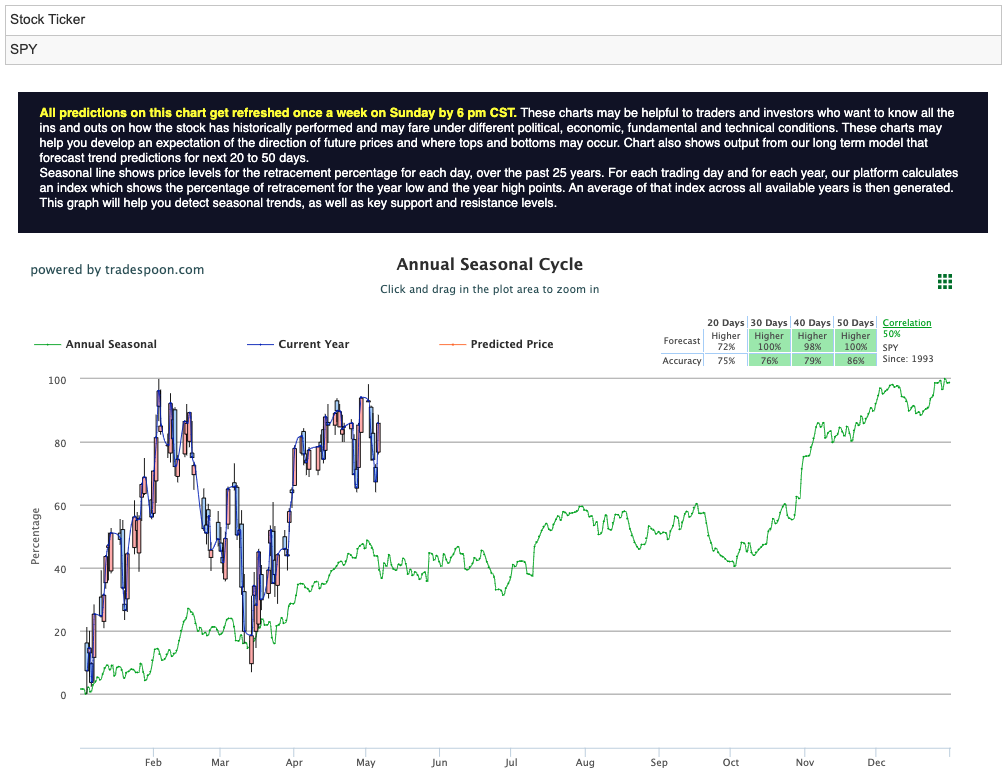
We are watching the overhead resistance levels in the SPY, which are presently at $418 and then $430. The $SPY support is at $410 and then $406. We expect the market to trade sideways for the next 2-8 weeks and we would be MARKET BEARISH at this time – encouraging subscribers to hedge their positions. Market commentary readers should maintain clearly defined stop levels for all positions. For reference, the SPY Seasonal Chart is shown below:

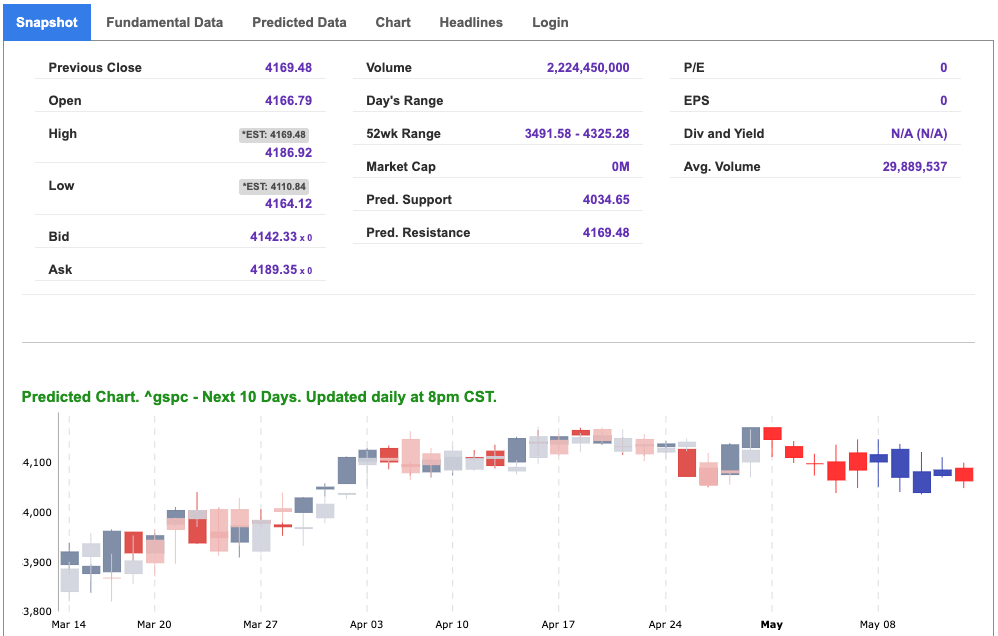

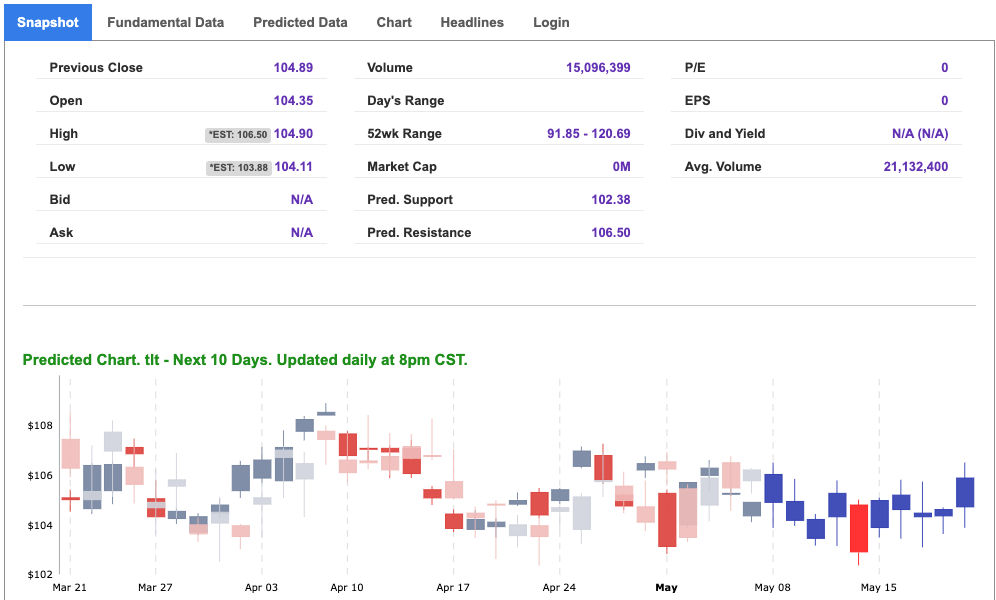
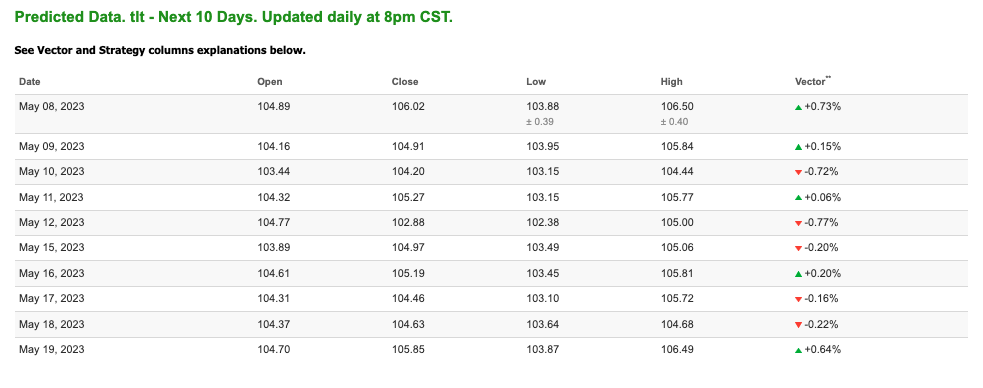
Note: The Vector column calculates the change of the Forecasted Average Price for the next trading session relative to the average of actual prices for the last trading session. The column shows the expected average price movement “Up or Down”, in percent. Trend traders should trade along the predicted direction of the Vector. The higher the value of the Vector the higher its momentum.
*Please note: At the time of publication Vlad Karpel does have a position in the featured symbol, lly. Our featured symbol is part of your free subscription service. It is not included in any paid Tradespoon subscription service. Vlad Karpel only trades his money in paid subscription services. If you are a paid subscriber, please review your Premium Member Picks, ActiveTrader, or MonthlyTrader recommendations. If you are interested in receiving Vlad’s picks, please click here.
West Texas Intermediate for Crude Oil delivery (CL.1) is priced at $72.80 per barrel, up 2.05%, at the time of publication.
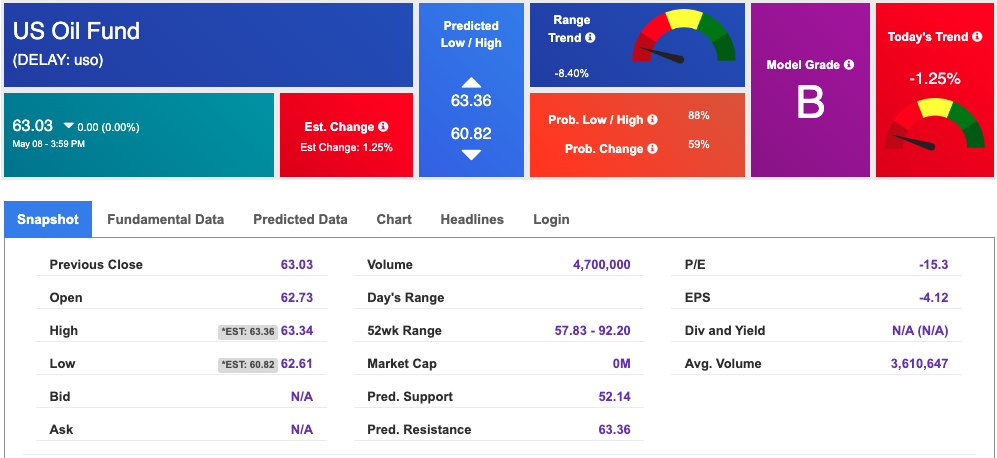
Looking at USO, a crude oil tracker, our 10-day prediction model shows mixed signals. The fund is trading at $63.03 at the time of publication. Prediction data is uploaded after the market close at 6 p.m., CST. Today’s data is based on market signals from the previous trading session.
The price for the Gold Continuous Contract (GC00) is up 0.18% at $2028.50 at the time of publication.
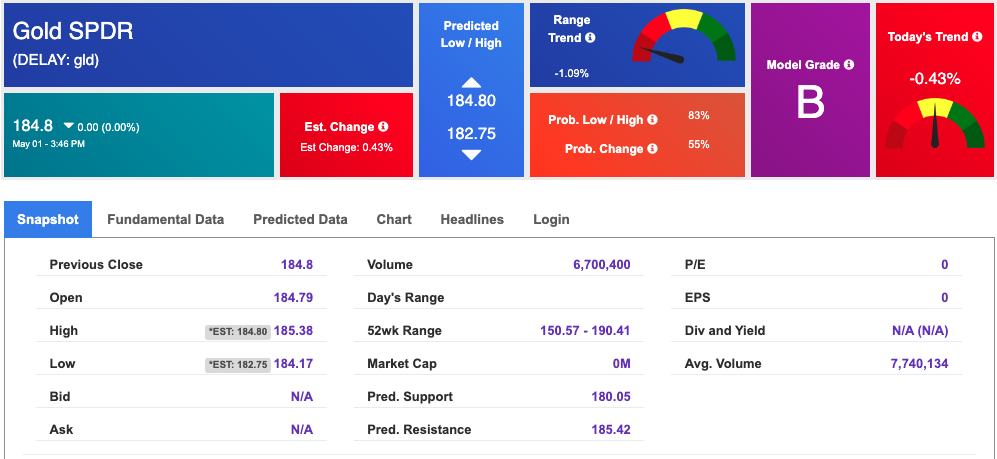
Using SPDR GOLD TRUST (GLD) as a tracker in our Stock Forecast Tool, the 10-day prediction window shows mixed signals. The gold proxy is trading at $187.46 at the time of publication. Vector signals show -0.21% for today. Prediction data is uploaded after the market close at 6 p.m., CST. Today’s data is based on market signals from the previous trading session.
The yield on the 10-year Treasury note is up at 3.513% at the time of publication.
The yield on the 30-year Treasury note is up at 3.825% at the time of publication.
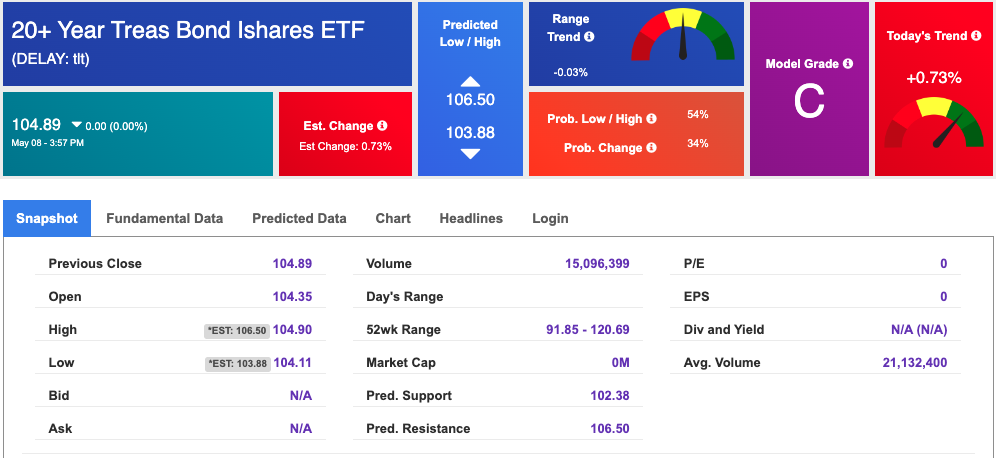
Using the iShares 20+ Year Treasury Bond ETF (TLT) as a proxy for bond prices in our Stock Forecast Tool, we see mixed signals in our 10-day prediction window. Prediction data is uploaded after the market close at 6 p.m., CST. Today’s data is based on market signals from the previous trading session.
The CBOE Volatility Index (^VIX) is $16.98 at the time of publication, and our 10-day prediction window shows mixed signals. Prediction data is uploaded after the market close at 6 p.m., CST. Today’s data is based on market signals from the previous trading session.
Comments Off on
Tradespoon Tools make finding winning trades in minute as easy as 1-2-3.
Our simple 3 step approach has resulted in an average return of almost 20% per trade!