 Special Offer: Try the 'Premium Membership' for ONLY $37!
CLICK HERE TO LEARN MORE
Special Offer: Try the 'Premium Membership' for ONLY $37!
CLICK HERE TO LEARN MORE
Stocks surged on Monday following a turbulent week marked by a broad market selloff. September has kicked off with a sharp pullback, driven by underwhelming macroeconomic data and a noticeable uptick in volatility. Disappointing labor and economic reports from the previous week have raised concerns that the Federal Reserve may be misjudging the economic situation, despite increasing market expectations for a potential quarter-point interest rate cut later this month.
The key focus of last week was labor data, which sent ripples through the markets. The August jobs report failed to reassure investors, showing that nonfarm payrolls grew by only 140,000, falling short of the anticipated 160,000. Further compounding the issue, revisions to prior months wiped out an additional 86,000 jobs from previous estimates. While the unemployment rate dipped slightly to 4.2%, the acceleration of wage growth at 0.4% added fuel to inflationary fears.
Adding to the uncertainty were mixed signals from other economic indicators. The ADP payroll report also disappointed, showing weaker job creation, while jobless claims did offer some improvement. Still, it wasn’t enough to dispel mounting fears of a slowing economy. The juxtaposition of these factors has left many wondering if the Fed has fallen behind in its efforts to control inflation without hampering growth.
This week, all eyes will be on the upcoming inflation reports, including the Consumer Price Index (CPI) due on Wednesday and the Producer Price Index (PPI) scheduled for Thursday. Anxiety is building around the possibility of a larger-than-expected half-point rate cut by the Federal Reserve, which could indicate the central bank is more concerned about the economy’s health than the market initially thought.
Equity investors are navigating a tightrope—balancing between celebrating the possibility of lower interest rates and worrying that a significant rate cut could signal deeper economic troubles. Monday’s market activity leaned toward optimism as risk-on sentiment prevailed, with investors willing to bet on a more dovish Fed.
Among the megacap technology stocks, most ended the day in the green. Shares of Amazon, Nvidia, Microsoft, Meta Platforms, and Tesla all posted gains. Alphabet was the notable exception, closing the session considerably lower.
Apple’s stock remained flat despite the unveiling of its newest iPhone 16 models, which kept pricing consistent with prior versions. Apple’s market capitalization now sits at a staggering $3.36 trillion, reaffirming its position as the largest U.S. company. The tech giant’s latest phone boasts enhanced artificial intelligence features, a move that could boost its stock in the longer term and further fuel the AI-driven investment narrative in the markets. While Apple opened the day in the red, it managed to close the session with only marginal losses.
While the markets may have found some footing at the start of the week, uncertainty remains. I remain firmly in the market-neutral camp, as signs point to the top already being set. Inflation, while coming in within expectations, continues to weigh on sentiment, and while the recent earnings season has exceeded expectations, the broader risk profile is shifting.
The economy is cooling, with unemployment slowly ticking upward, and concerns around small banks—particularly their exposure to commercial and residential real estate—are raising alarms about potential failures. The risk of recession appears to be creeping closer, amplifying caution among investors.
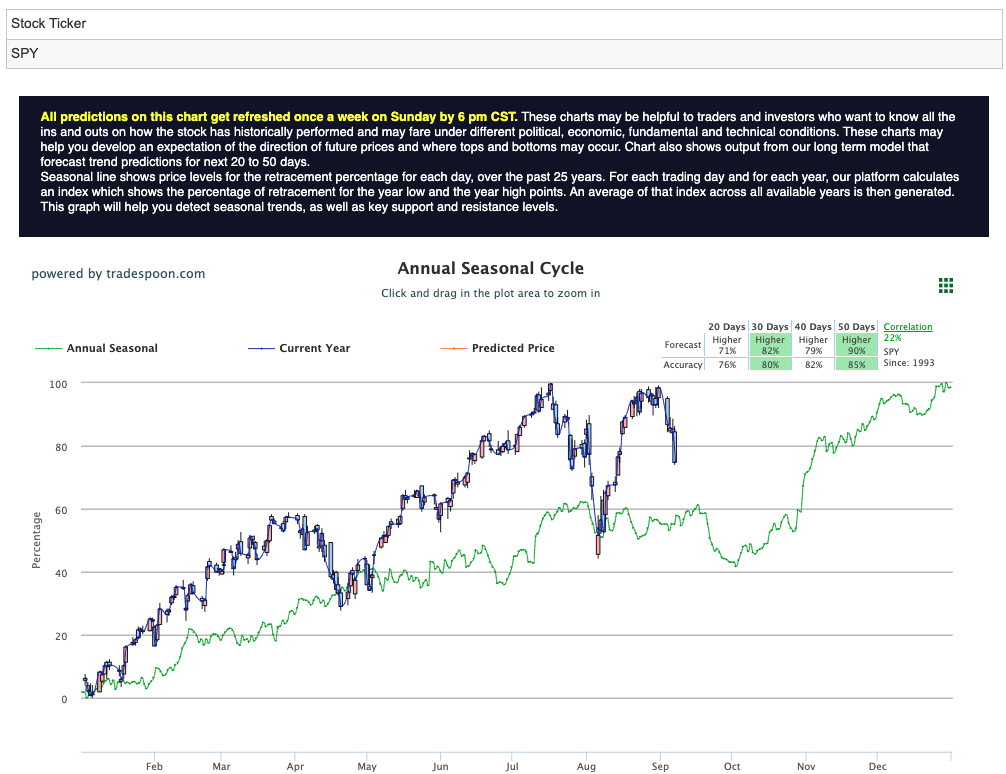
For the SPY, the rally seems capped at the $560–$575 range, while short-term support levels rest between $480 and $510. Over the next few months, I expect the market to trade sideways in the short to medium term, even as the long-term trend remains intact. For reference, the SPY Seasonal Chart is shown below:
This week, investors will be keeping a close eye on critical inflation reports such as the CPI, PPI, and import prices. Additionally, earnings reports from key companies like Oracle, Adobe, GameStop, and Lennar could provide fresh clues on market direction and sentiment.
With the market correction far from over, maintaining a cautious stance is essential. As volatility rises, chasing short-term rebounds could lead to significant losses. A market-neutral approach appears prudent, as downside risks continue to outweigh the potential upside. The “hard landing” scenario is gaining traction in financial circles, and patience will be crucial as investors navigate the uncertain path ahead.
The key takeaway: Stay vigilant and avoid hasty moves—the market’s current trajectory suggests that further challenges lie ahead.
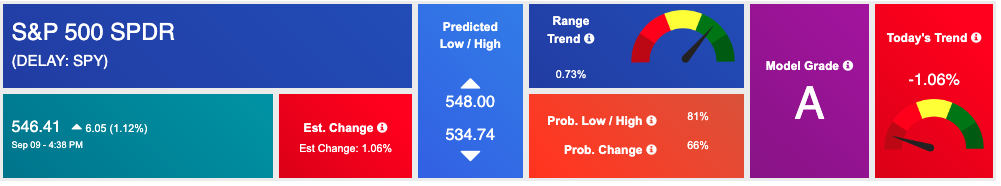
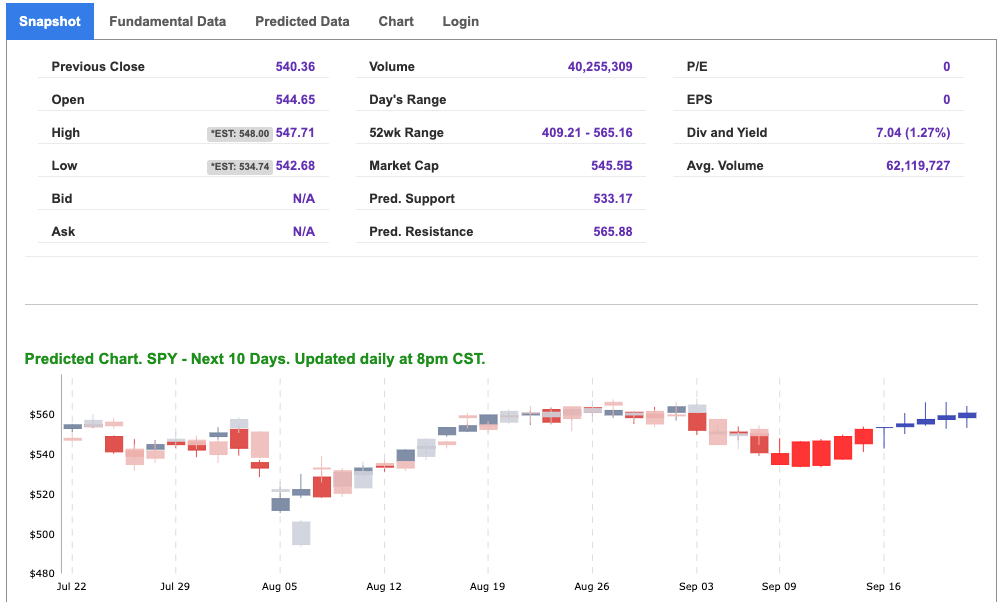
Using the “SPY” symbol to analyze the S&P 500 our 10-day prediction window shows a near-term positive outlook. Prediction data is uploaded after the market closes at 6 p.m. CST. Today’s data is based on market signals from the previous trading session.
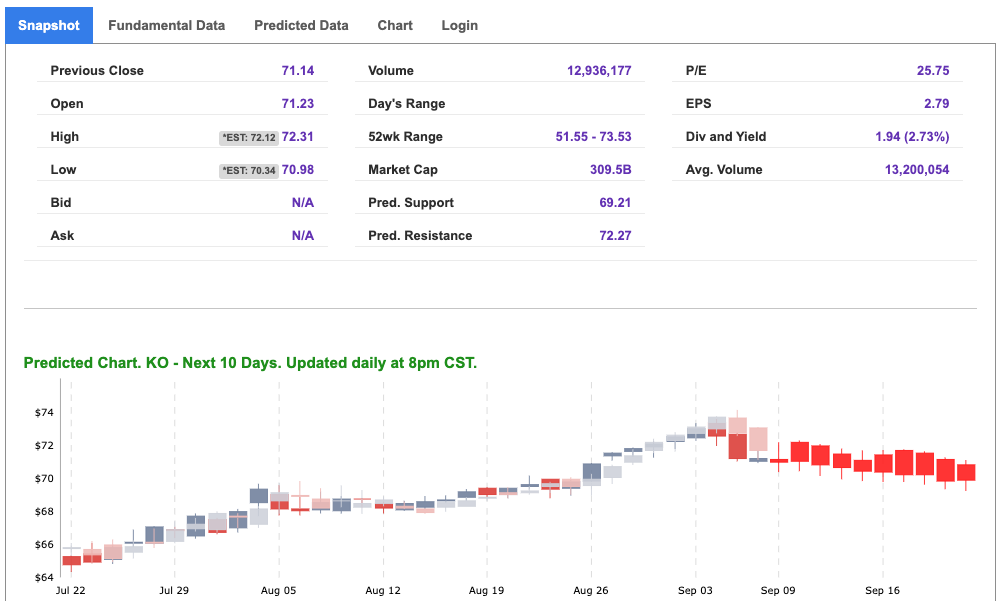
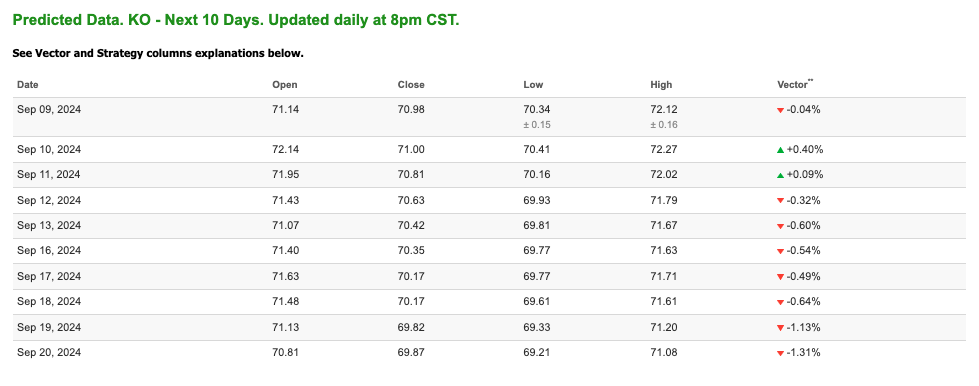
Note: The Vector column calculates the change of the Forecasted Average Price for the next trading session relative to the average of actual prices for the last trading session. The column shows the expected average price movement “Up or Down”, in percent. Trend traders should trade along the predicted direction of the Vector. The higher the value of the Vector the higher its momentum.
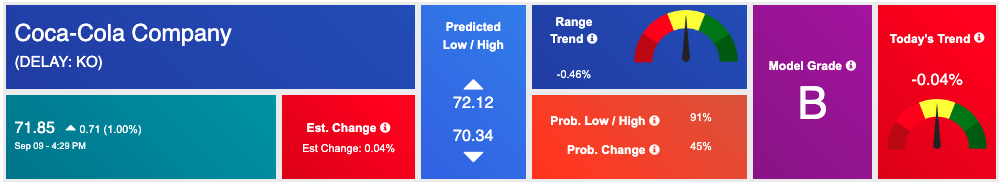
*Please note: At the time of publication Vlad Karpel does have a position in the featured symbol, KO. Our featured symbol is part of your free subscription service. It is not included in any paid Tradespoon subscription service. Vlad Karpel only trades his money in paid subscription services. If you are a paid subscriber, please review your Premium Member Picks, ActiveTrader, or MonthlyTrader recommendations. If you are interested in receiving Vlad’s picks, please click here.
West Texas Intermediate for Crude Oil delivery (CL.1) is priced at $68.80 per barrel, up 1.67%, at the time of publication.
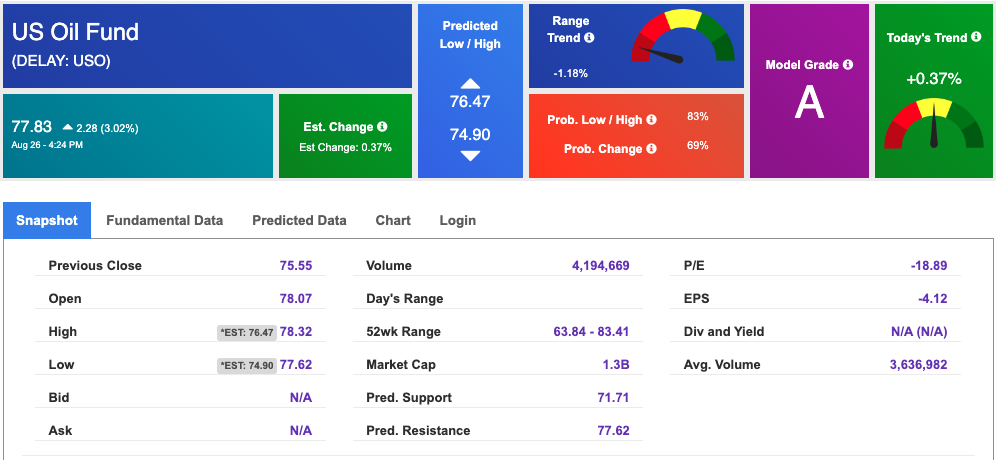
Looking at USO, a crude oil tracker, our 10-day prediction model shows mixed signals. The fund is trading at $77.83 at the time of publication. Prediction data is uploaded after the market close at 6 p.m., CST. Today’s data is based on market signals from the previous trading session.
The price for the Gold Continuous Contract (GC00) is up 0.43% at $2,535.50 at the time of publication.
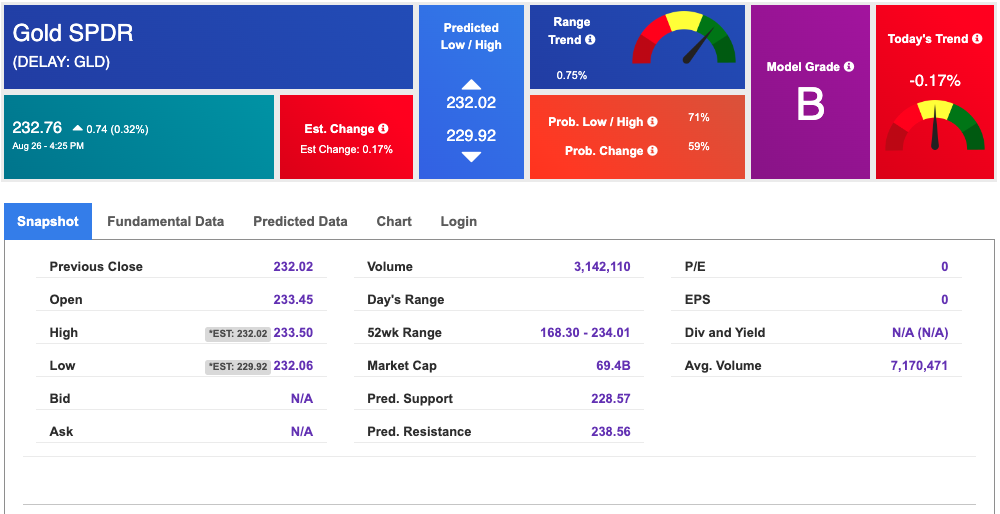
Using SPDR GOLD TRUST (GLD) as a tracker in our Stock Forecast Tool, the 10-day prediction window shows mixed signals. The gold proxy is trading at $232.76 at the time of publication. Vector signals show -0.17% for today. Prediction data is uploaded after the market close at 6 p.m., CST. Today’s data is based on market signals from the previous trading session.
The yield on the 10-year Treasury note is down at 3.704% at the time of publication.
The yield on the 30-year Treasury note is down at 4.0003% at the time of publication.
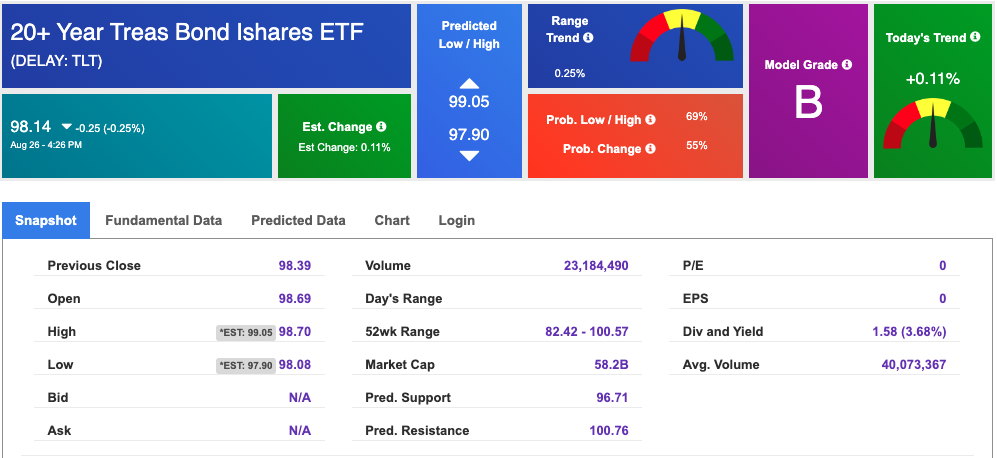
Using the iShares 20+ Year Treasury Bond ETF (TLT) as a proxy for bond prices in our Stock Forecast Tool, we see mixed signals in our 10-day prediction window. Prediction data is uploaded after the market close at 6 p.m., CST. Today’s data is based on market signals from the previous trading session.
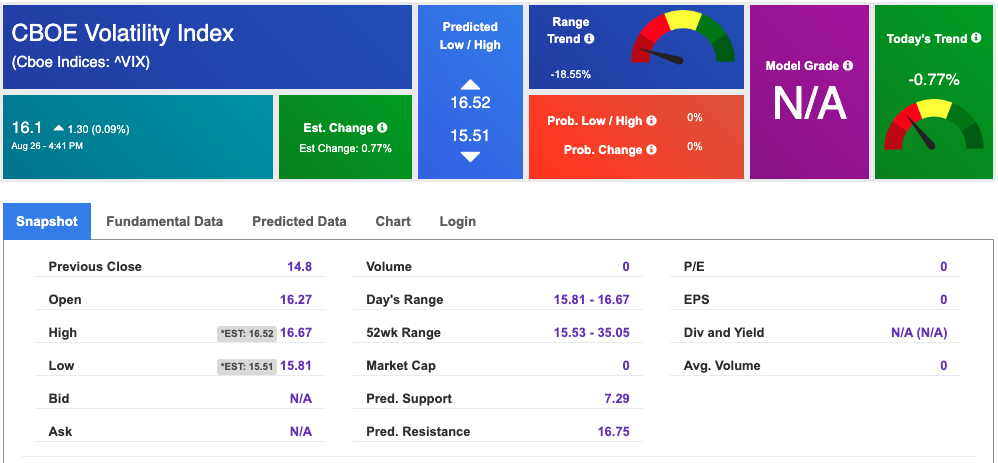
The CBOE Volatility Index (^VIX) is priced at $16.1 up 0.09% at the time of publication, and our 10-day prediction window shows mixed signals. Prediction data is uploaded after the market close at 6 p.m., CST. Today’s data is based on market signals from the previous trading session.
Please share this Tradespoon Market Commentary with your friends.
![]()

![]()
Comments Off on


Tradespoon Tools make finding winning trades in minute as easy as 1-2-3.
Our simple 3 step approach has resulted in an average return of almost 20% per trade!

