The next move in the market can be influenced by companies’ earnings, such as $CAG and $STZ, as well as government decisions on interest rates and reactions thereafter. August job reports are due this week as well as ADP employment data for September on Wednesday. Additional employment data will be released on Friday with unemployment rate and average hourly earnings, while several inflation-related data will also be released this week. FOMC minutes, CPI and retail data, and major earnings reports are due the following week. The rally in the market was slightly stifled by an ISM manufacturing report which came far lower than expected. However, U.S. stocks were able to post impressive gains across the board.
On Monday, the Dow Jones Industrial Average had one of its best days this year as investors contemplated the possibility of a Federal Reserve which might have to retreat from assertively tighter monetary policy. This eased markets as the S&P and Nasdaq also traded impressively higher, with the latter up over 5%. While fears of recession remain prominent, the market appeared to release some tension today with an overdue rally which sent shares higher as Fed action was reevaluated and additional economic data released. One of which included the Institute for Supply Management which reported that its manufacturing index fell to a 28-month low of 50.9% in September as high inflation and rapidly rising U.S. interest rates began to rattle the economy; this number was much lower than estimates, prolonging several gains in major stock indices.
Last week, markets traded lower throughout as several central banks updated policies overseas. Following the announcement that Japan and England’s central bank will each continue their bond buying program aggressively, markets began to fluctuate as mixed messages alongside mixed economic reports began to puzzle market observers. Ultimately, most of the market closed lower, with commodities and global markets in the red. The dollar surged to a twenty-year high, supporting the notion of an upcoming market dip while also affirming a strong bottom. Inflation appears to be a long-term issue, and short-term U.S. yields have risen dramatically, now trading near 4%. Despite some deterioration from this week’s peak, if they maintain a level above 3.5%, there is still the potential for more market pressure.
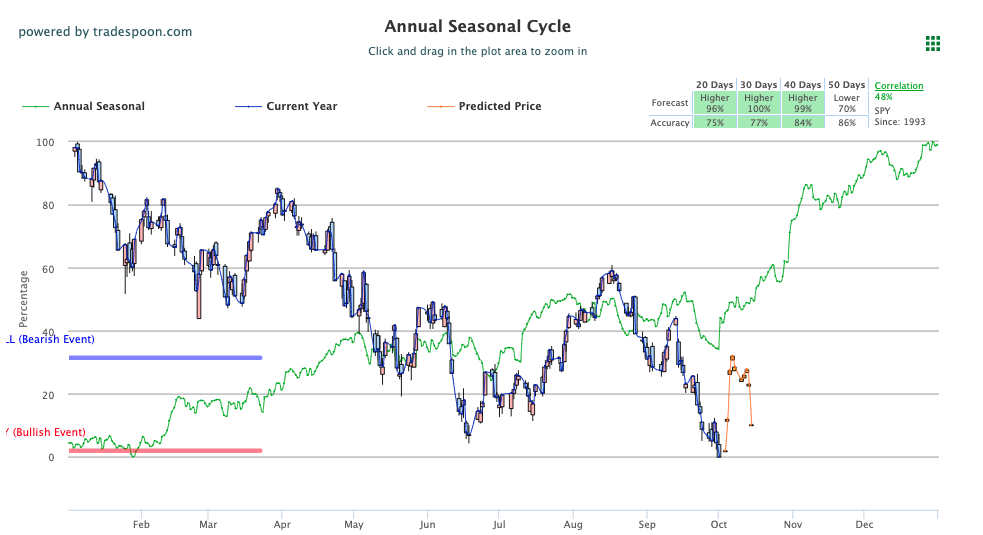
We are watching the overhead resistance levels in the SPY, which are presently at $376 and then $390. The $SPY support is at $355 and then $340. We expect the market to continue the current pullback for the next 2-8 weeks. Short term market is oversold and can stage a multiple sessions rally. We would be a seller into any further rallies and encourage subscribers not to chase the market at these levels. We encourage all market commentary readers to maintain clearly defined stop levels for all positions. For reference, the SPY Seasonal Chart is shown below:

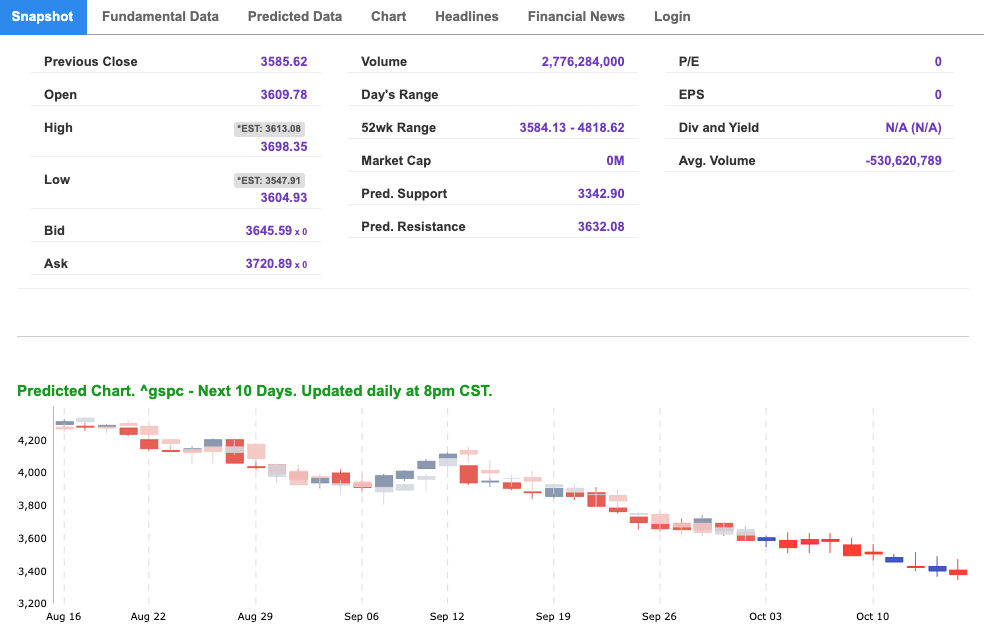

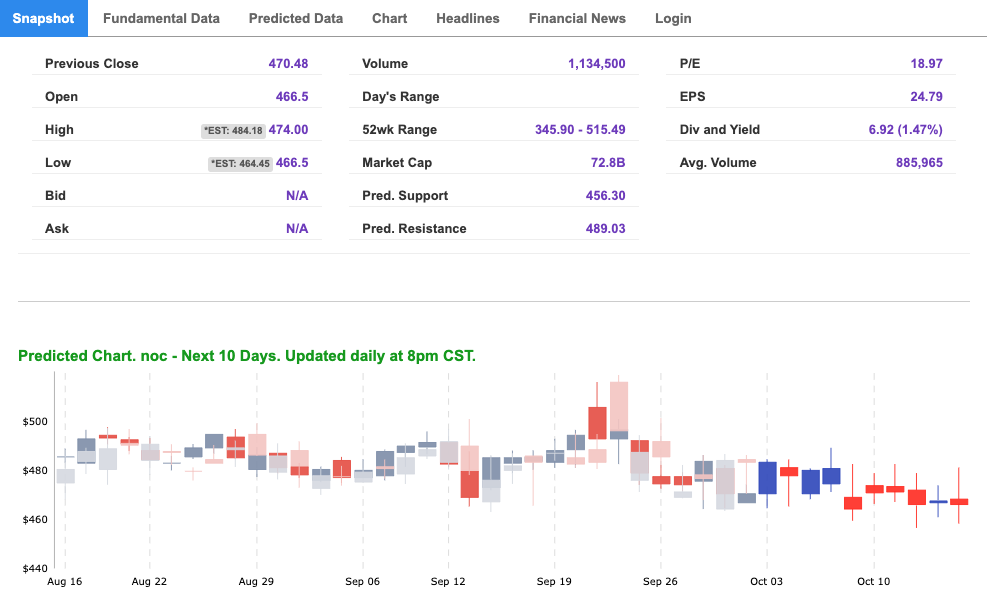
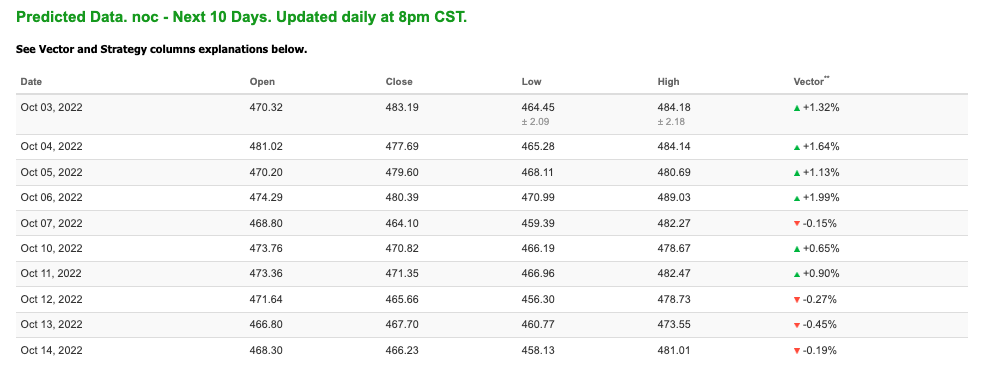
Note: The Vector column calculates the change of the Forecasted Average Price for the next trading session relative to the average of actual prices for the last trading session. The column shows the expected average price movement “Up or Down”, in percent. Trend traders should trade along the predicted direction of the Vector. The higher the value of the Vector the higher its momentum.
*Please note: At the time of publication Vlad Karpel does have a position in the featured symbol, NOC. Our featured symbol is part of your free subscription service. It is not included in any paid Tradespoon subscription service. Vlad Karpel only trades his money in paid subscription services. If you are a paid subscriber, please review your Premium Member Picks, ActiveTrader, or MonthlyTrader recommendations. If you are interested in receiving Vlad’s picks, please click here.
West Texas Intermediate for Crude Oil delivery (CL.1) is priced at $83.34 per barrel, up 4.84%, at the time of publication.
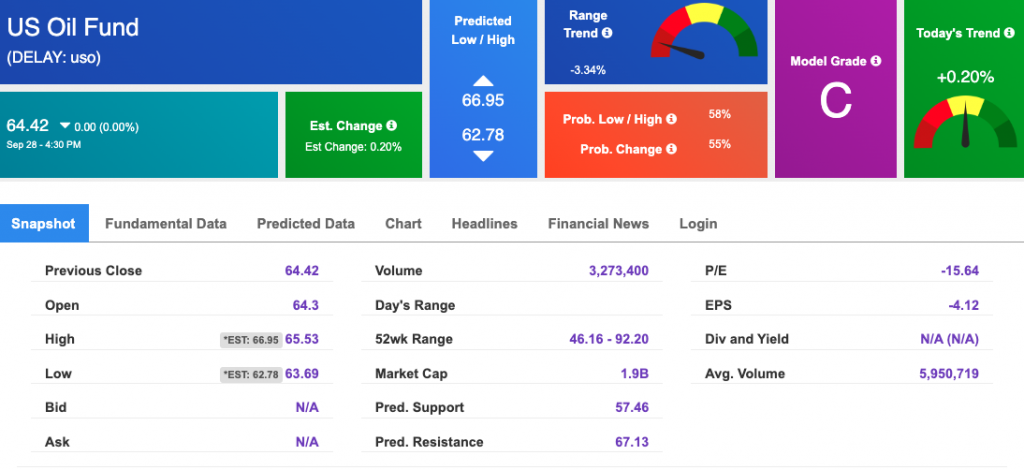
Looking at USO, a crude oil tracker, our 10-day prediction model shows mixed signals. The fund is trading at $64.42 at the time of publication. Prediction data is uploaded after the market close at 6 p.m., CST. Today’s data is based on market signals from the previous trading session.
The price for the Gold Continuous Contract (GC00) is up 2.19% at $1708.60 at the time of publication.
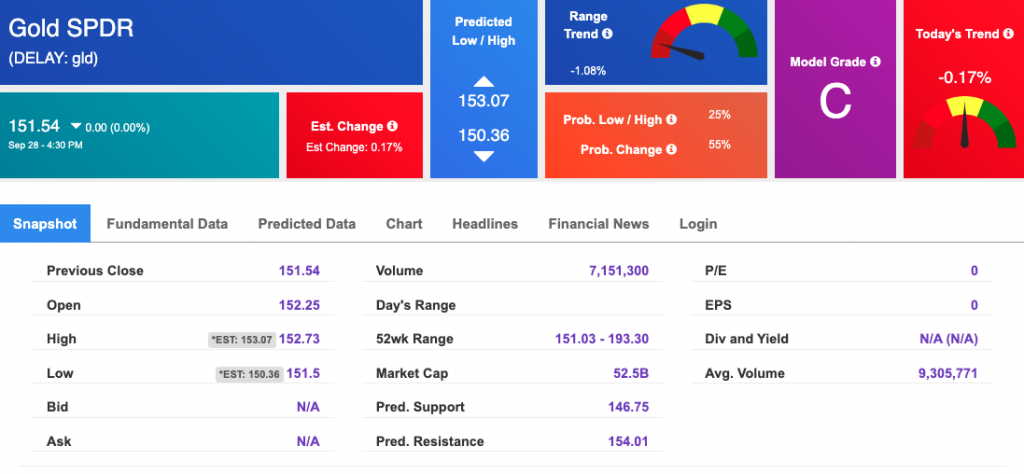
Using SPDR GOLD TRUST (GLD) as a tracker in our Stock Forecast Tool, the 10-day prediction window shows mixed signals. The gold proxy is trading at $151.54 at the time of publication. Vector signals show -0.17% for today. Prediction data is uploaded after the market close at 6 p.m., CST. Today’s data is based on market signals from the previous trading session.
The yield on the 10-year Treasury note is down, at 3.736% at the time of publication.
The yield on the 30-year Treasury note is down, at 3.702% at the time of publication.
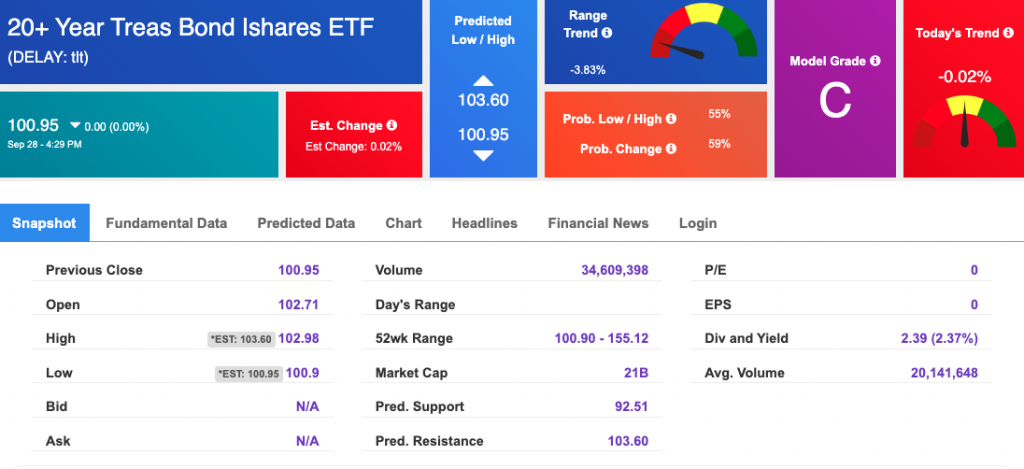
Using the iShares 20+ Year Treasury Bond ETF (TLT) as a proxy for bond prices in our Stock Forecast Tool, we see mixed signals in our 10-day prediction window. Prediction data is uploaded after the market close at 6 p.m., CST. Today’s data is based on market signals from the previous trading session.
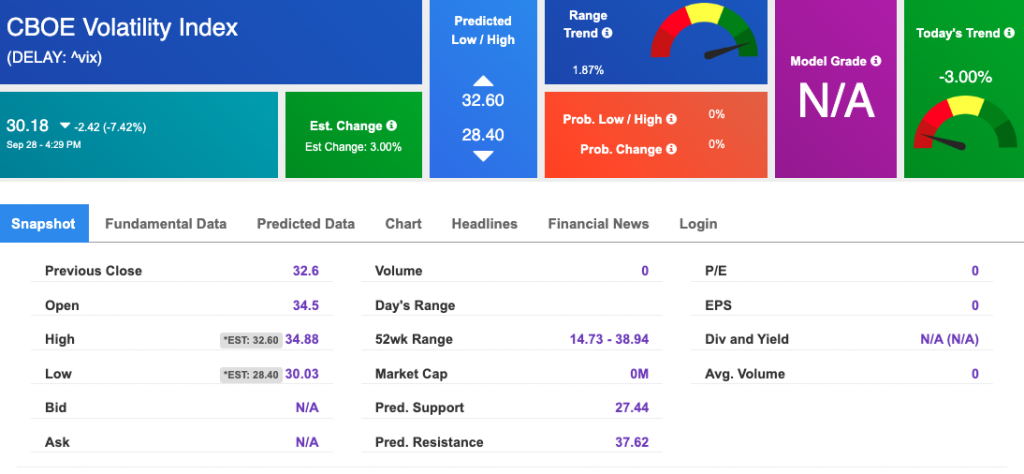
The CBOE Volatility Index (^VIX) is $30.18 at the time of publication, and our 10-day prediction window shows mixed signals. Prediction data is uploaded after the market close at 6 p.m., CST. Today’s data is based on market signals from the previous trading session.
Comments Off on
Tradespoon Tools make finding winning trades in minute as easy as 1-2-3.
Our simple 3 step approach has resulted in an average return of almost 20% per trade!