On Wednesday, the Nasdaq Composite dropped 1.1%, as cooler-than-expected economic data raised concerns about the overall health of the economy. The Dow Jones Industrial Average, meanwhile, gained 80 points, or 0.2%, while the S&P 500 shed 0.3%. The dip in the Nasdaq is a sign that the market remains focused on interest rates and the general health of the economy, with investors paying close attention to the Federal Reserve’s efforts to combat high inflation.
Several reports released today have already impacted market sentiment. The ISM services index for March fell to 51.2 from the 55.1 reported in February, below expectations of 54.5. Still, a reading above 50 indicates growth in the sector. ADP Research Institute reported that private employers added 145,000 jobs in March, down from the revised 261,000 reported for the previous month. This figure is also lower than the expected 205,000 jobs.
As private employers added fewer jobs than expected, and mortgage applications saw a four-week decline, the Fed’s potential for raising interest rates this year is being closely monitored. The upcoming U.S. jobs report for March is a key economic indicator; the tight labor market is of particular interest to the Fed. Look out for weekly jobless data to be released on Thursday, while Friday will feature the March U.S employment, unemployment, and average hourly wage figures. Also worth noting, the latest decision by the OPEC+ group of crude-producing nations to cut output has added to inflationary fears. Cleveland Fed President Loretta Mester’s suggestion that rates should go above 5% has also created headwinds.
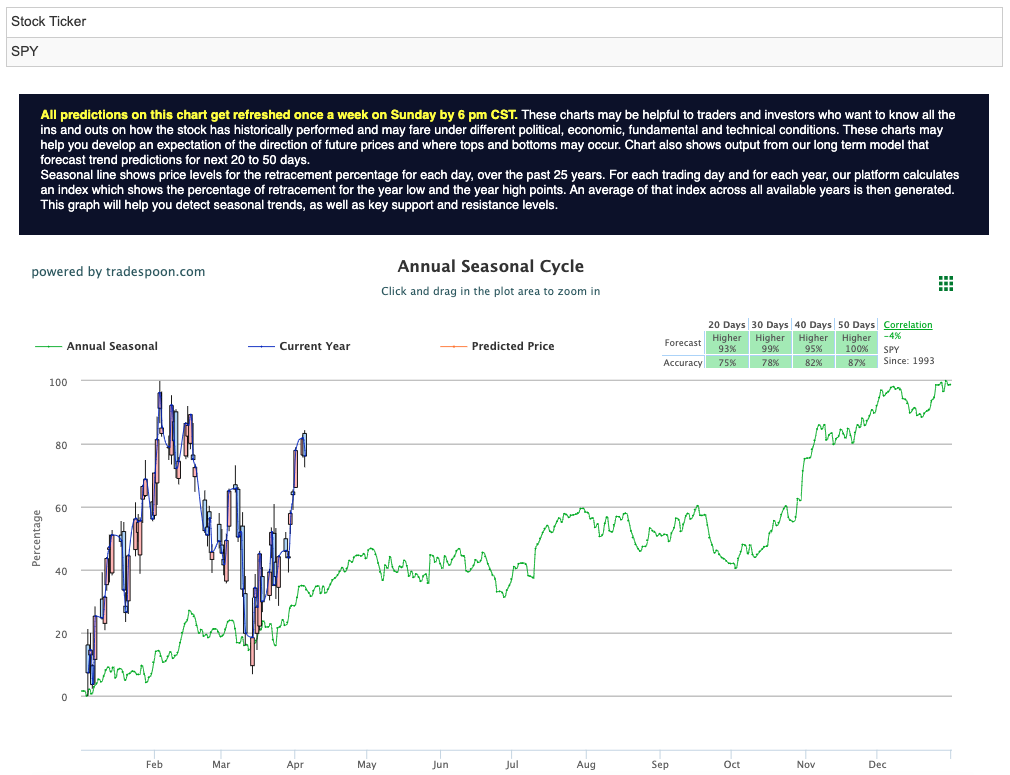
Market watchers are paying close attention to the $VIX, which is trading near the $18 level. The earnings reports of $STZ and $CAG this week, as well as the March unemployment data, could influence the next move in the market. The SPY’s overhead resistance levels, presently at $412 and $418, and support levels, currently at $406 and $402, are also being closely monitored. We still see the market trading sideways for the next two to eight weeks and therefore recommend remaining market neutral at this time while encouraging readers to hedge their positions. For reference, the SPY Seasonal Chart is shown below:

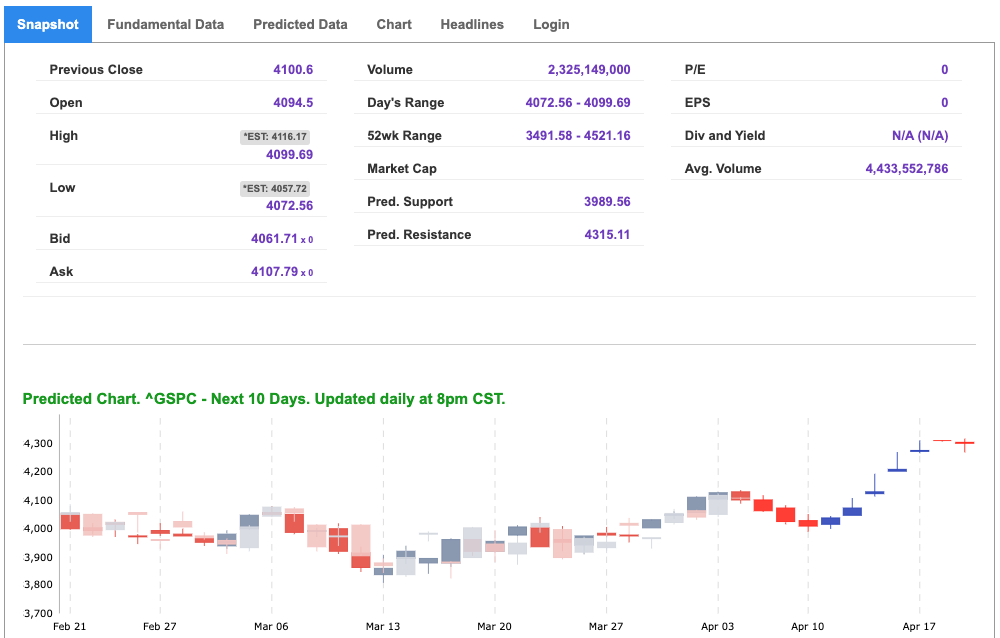

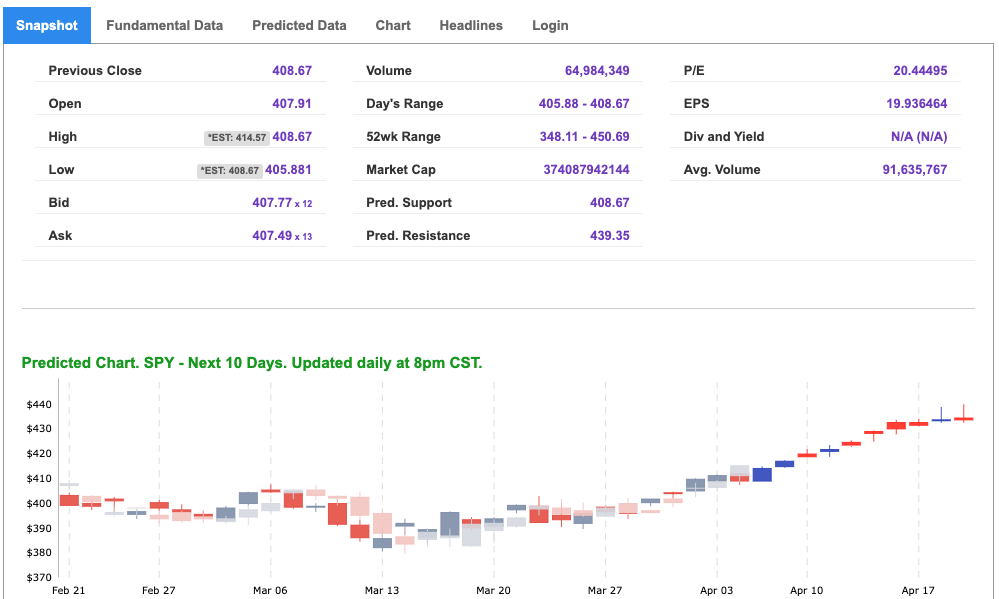
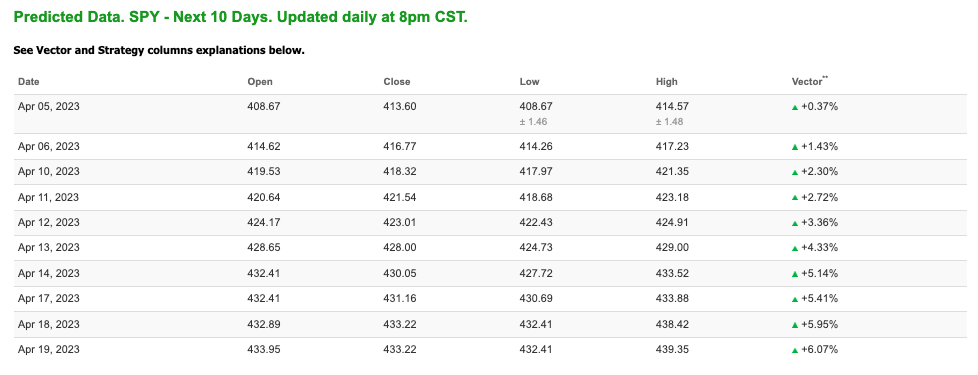
Note: The Vector column calculates the change of the Forecasted Average Price for the next trading session relative to the average of actual prices for the last trading session. The column shows the expected average price movement “Up or Down”, in percent. Trend traders should trade along the predicted direction of the Vector. The higher the value of the Vector the higher its momentum.
*Please note: At the time of publication Vlad Karpel does have a position in the featured symbol, spy. Our featured symbol is part of your free subscription service. It is not included in any paid Tradespoon subscription service. Vlad Karpel only trades his money in paid subscription services. If you are a paid subscriber, please review your Premium Member Picks, ActiveTrader, or MonthlyTrader recommendations. If you are interested in receiving Vlad’s picks, please click here.
West Texas Intermediate for Crude Oil delivery (CL.1) is priced at $80.35 per barrel, down 0.45%, at the time of publication.
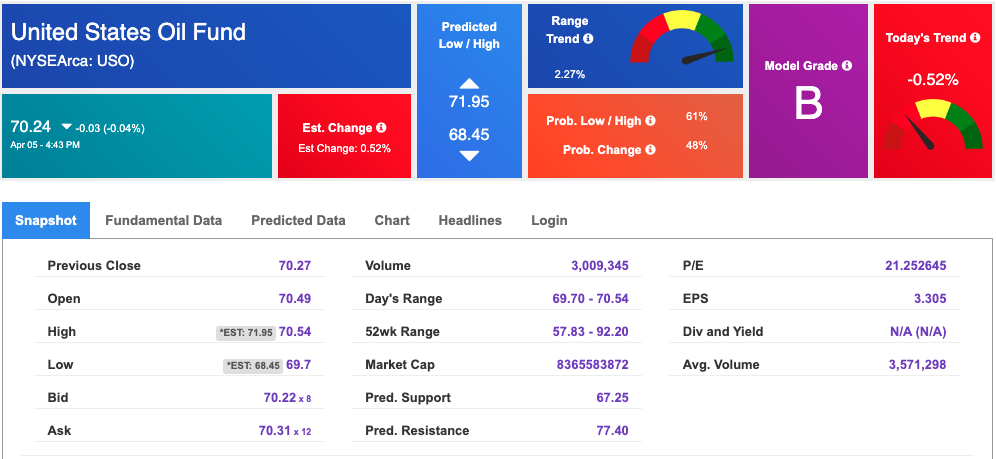
Looking at USO, a crude oil tracker, our 10-day prediction model shows mixed signals. The fund is trading at $70.24 at the time of publication. Prediction data is uploaded after the market close at 6 p.m., CST. Today’s data is based on market signals from the previous trading session.
The price for the Gold Continuous Contract (GC00) is down 0.05% at $2037.10 at the time of publication.
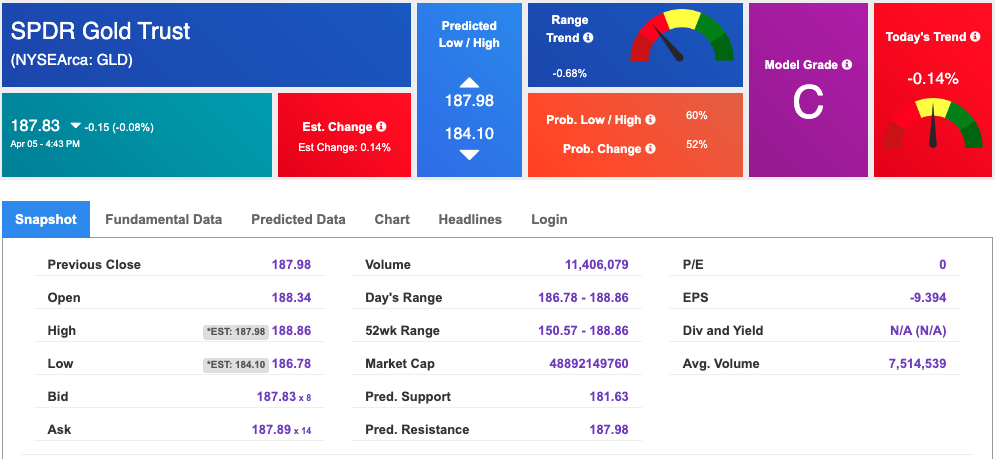
Using SPDR GOLD TRUST (GLD) as a tracker in our Stock Forecast Tool, the 10-day prediction window shows mixed signals. The gold proxy is trading at $187.83 at the time of publication. Vector signals show -0.14% for today. Prediction data is uploaded after the market close at 6 p.m., CST. Today’s data is based on market signals from the previous trading session.
The yield on the 10-year Treasury note is down at 3.313% at the time of publication.
The yield on the 30-year Treasury note is down at 3.572% at the time of publication.
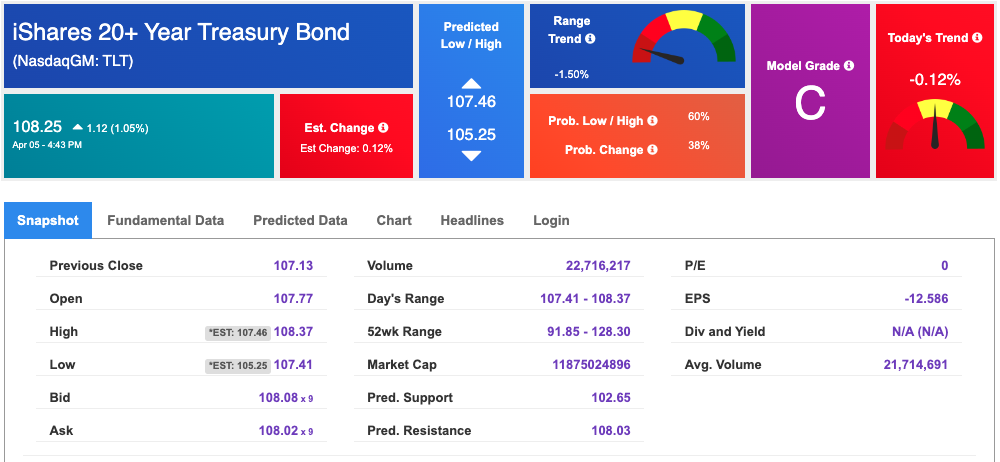
Using the iShares 20+ Year Treasury Bond ETF (TLT) as a proxy for bond prices in our Stock Forecast Tool, we see mixed signals in our 10-day prediction window. Prediction data is uploaded after the market close at 6 p.m., CST. Today’s data is based on market signals from the previous trading session.
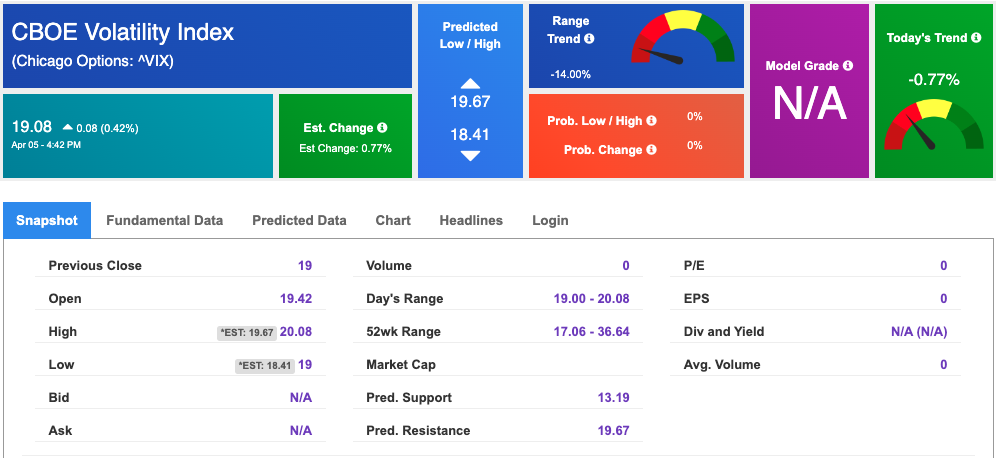
The CBOE Volatility Index (^VIX) is $19.08 at the time of publication, and our 10-day prediction window shows mixed signals. Prediction data is uploaded after the market close at 6 p.m., CST. Today’s data is based on market signals from the previous trading session.
Comments Off on
Tradespoon Tools make finding winning trades in minute as easy as 1-2-3.
Our simple 3 step approach has resulted in an average return of almost 20% per trade!