 Special Offer: Try the 'WeeklyTrader Membership' for ONLY $37!
CLICK HERE TO LEARN MORE
Special Offer: Try the 'WeeklyTrader Membership' for ONLY $37!
CLICK HERE TO LEARN MORE
In a mixed day for the stock market, the Nasdaq closed at a new record high on Monday, driven largely by gains in the technology sector, while the Dow Jones Industrial Average stumbled. Over half of the Dow’s components declined, weighing down the index. However, the S&P 500 and Nasdaq were buoyed by strong performances from chip stocks, ahead of Nvidia’s eagerly awaited earnings report on Wednesday.
Anticipation Builds for Retail and Nvidia Earnings
This week, market attention is turning towards upcoming earnings reports from major retailers and Nvidia’s highly anticipated results on Wednesday. Investors are keenly awaiting Nvidia’s performance, given its significant influence on the tech sector. Additionally, Palo Alto Networks is set to report earnings after the bell, adding to the week’s financial activity. Federal Reserve officials are also scheduled to make multiple appearances, likely providing further insights into the economic outlook.
Oil Market Stability Amid Geopolitical Turbulence
The oil markets displayed remarkable resilience, showing minimal reaction to the helicopter crash that claimed the lives of Iran’s president and foreign minister over the weekend. Despite the incident and poor weather conditions on Sunday, oil prices remained largely unaffected. Crude oil futures halted a three-session winning streak, with West Texas Intermediate (WTI) crude slipping below the $80 per barrel level reached on Friday. Conversely, U.S. natural gas futures sustained their three-week surge, fueled by early-season heat in Texas driving up demand and the anticipation of a gradual decline in inventory surpluses.
Gold and Silver Shine Amid Market Uncertainty
Precious metals saw significant gains, with gold prices continuing their upward trend. SPDR Gold Shares increased by 0.8%, while front-month gold futures rose by 0.9%. Silver futures also had a strong performance, with the front-month contract climbing 3.7%. The 10-year Treasury yield rose to 4.447%, reflecting ongoing market dynamics and investor sentiment.
Inflation Data Eases Market Concerns
Last week, the release of the Consumer Price Index (CPI) report provided a breath of relief to investors, showing a slight cooling in price gains for April. This led to a midweek rally, pushing all three major indexes to new closing highs. The CPI revealed a year-over-year gain of 3.4%, slightly down from March’s 3.5% increase. The report’s 0.3% monthly increase was softer than expected, signaling a potential easing of inflationary pressures.
The Producer Price Index (PPI) data, which had anticipated a 0.2% monthly increase and a 2.2% annual gain, showed an actual rise of 0.5% on the month. The year-over-year increase stood at 2.2%, aligning with forecasts. March’s PPI data was revised downwards, suggesting previous overestimations. Excluding food and energy, the PPI rose by 0.3% in April, surpassing expectations.
Federal Reserve Maintains Cautious Approach
Despite the encouraging inflation data, Federal Reserve officials remain cautious about altering interest rates. Chair Jerome Powell highlighted the need for patience, indicating that the central bank is likely to maintain its current monetary policy stance. He acknowledged the positive trend in inflation but expressed less confidence in meeting the Fed’s 2% target this year compared to earlier expectations.
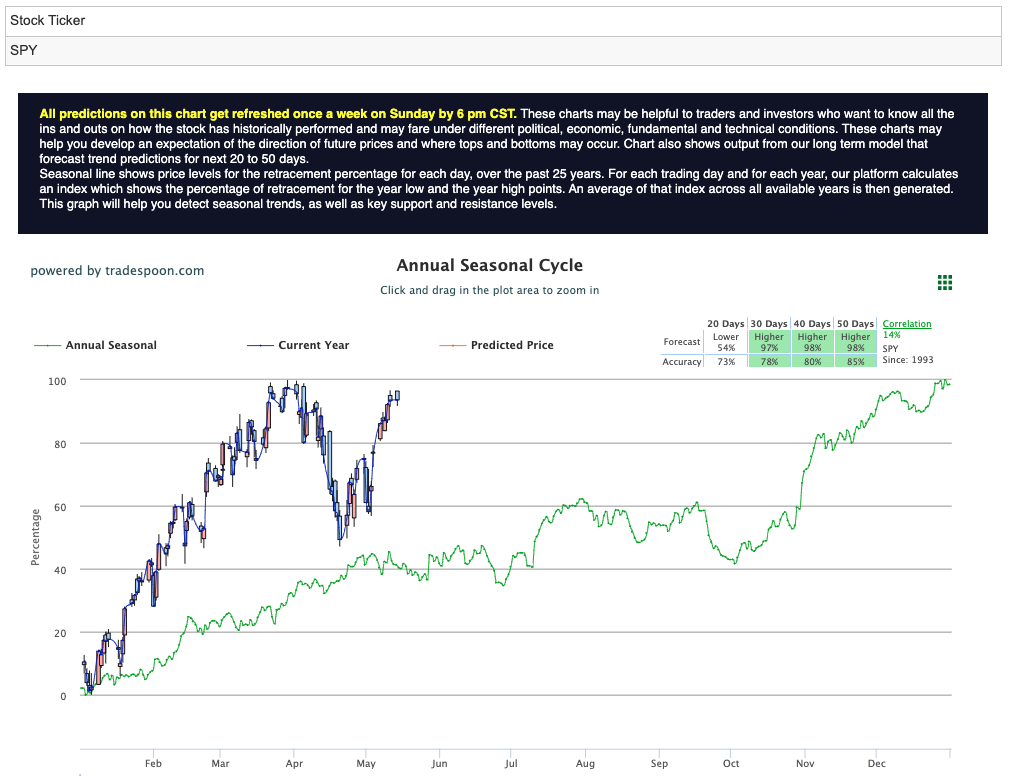
Navigating Market Volatility with Prudence
I am adopting a bullish stance, though I anticipate the SPY rally will be capped between $530 and $540, with short-term support ranging from $480 to $500 over the next few months. The Federal Reserve’s firm position on interest rates highlights the necessity of reducing inflation consistently without negatively impacting the labor market. For reference, the SPY Seasonal Chart is shown below:
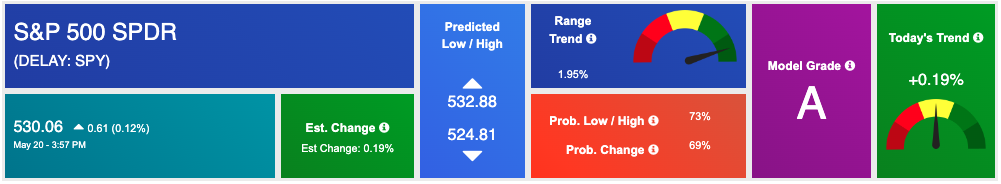
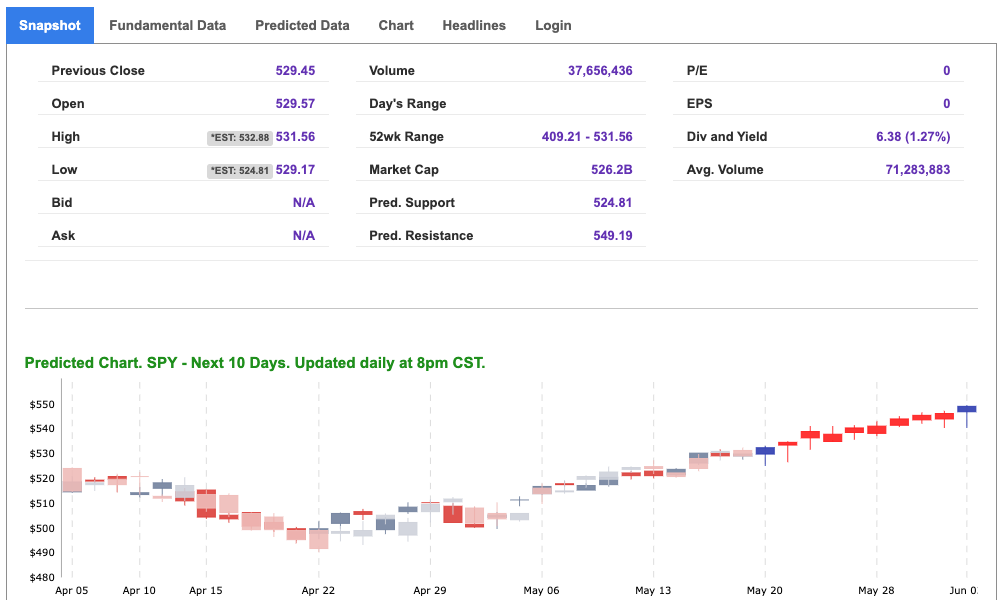
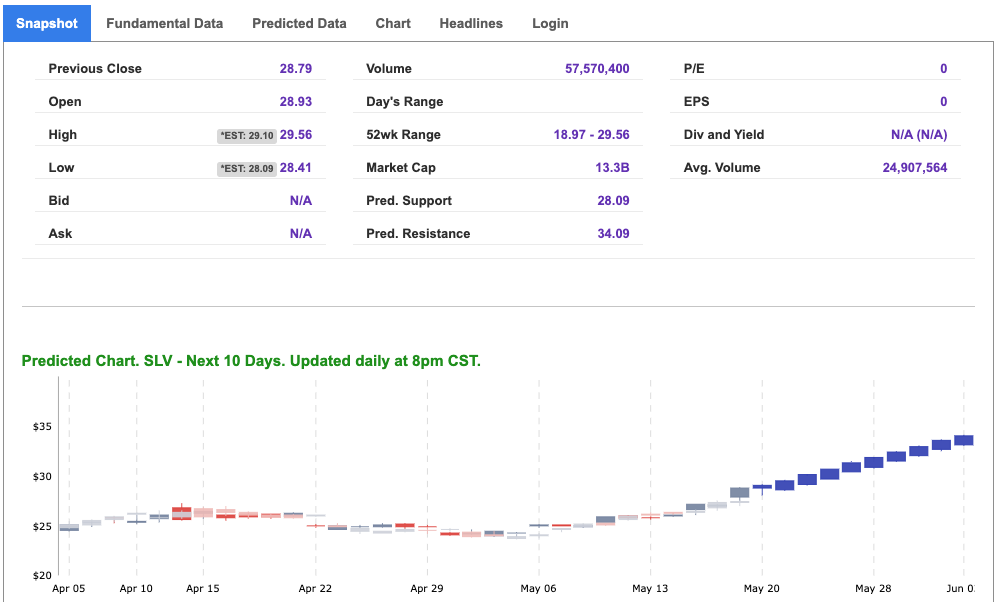
Using the “SPY” symbol to analyze the S&P 500 our 10-day prediction window shows a near-term positive outlook. Prediction data is uploaded after the market closes at 6 p.m. CST. Today’s data is based on market signals from the previous trading session.
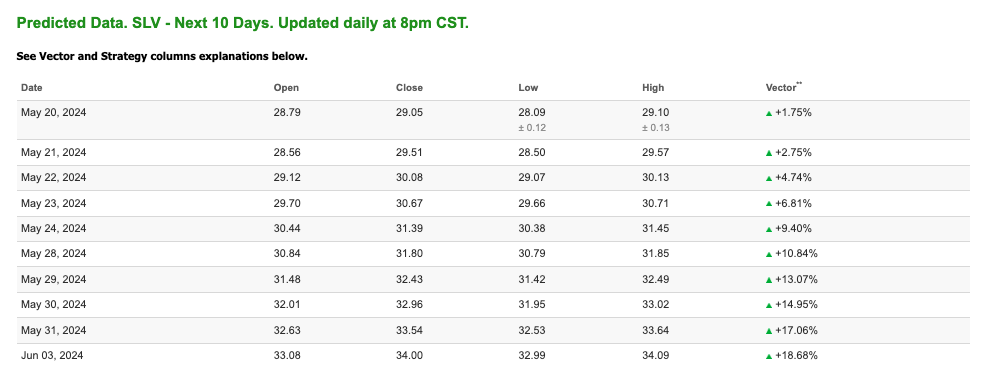
Note: The Vector column calculates the change of the Forecasted Average Price for the next trading session relative to the average of actual prices for the last trading session. The column shows the expected average price movement “Up or Down”, in percent. Trend traders should trade along the predicted direction of the Vector. The higher the value of the Vector the higher its momentum.
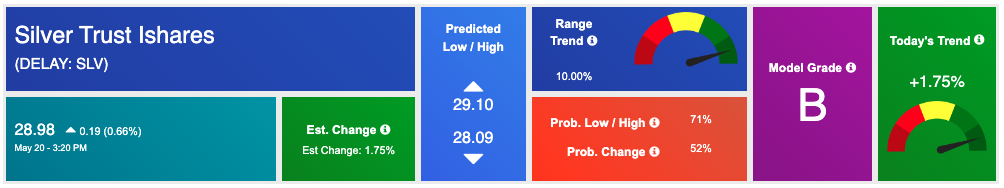
*Please note: At the time of publication Vlad Karpel does have a position in the featured symbol, SLV. Our featured symbol is part of your free subscription service. It is not included in any paid Tradespoon subscription service. Vlad Karpel only trades his money in paid subscription services. If you are a paid subscriber, please review your Premium Member Picks, ActiveTrader, or MonthlyTrader recommendations. If you are interested in receiving Vlad’s picks, please click here.
West Texas Intermediate for Crude Oil delivery (CL.1) is priced at $79.65 per barrel, down 0.51%, at the time of publication.
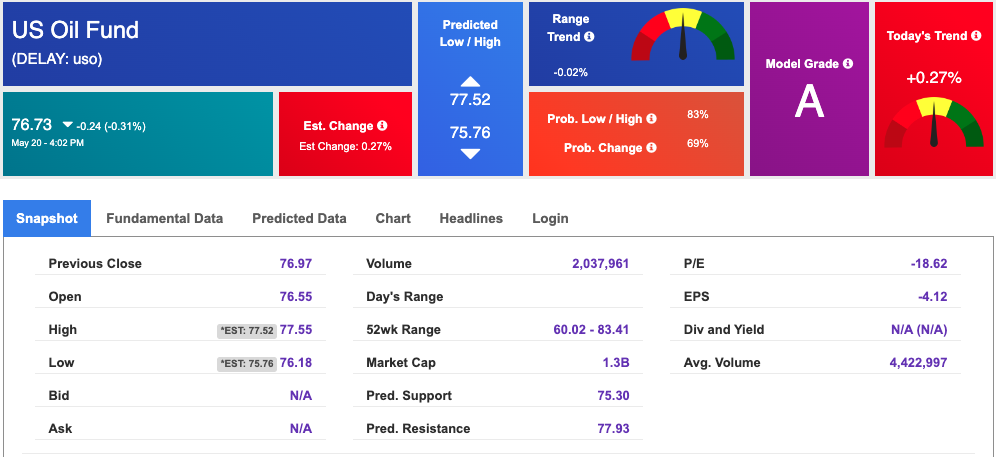
Looking at USO, a crude oil tracker, our 10-day prediction model shows mixed signals. The fund is trading at $76.73 at the time of publication. Prediction data is uploaded after the market close at 6 p.m., CST. Today’s data is based on market signals from the previous trading session.
The price for the Gold Continuous Contract (GC00) is up 0.53% at $2430.30 at the time of publication.
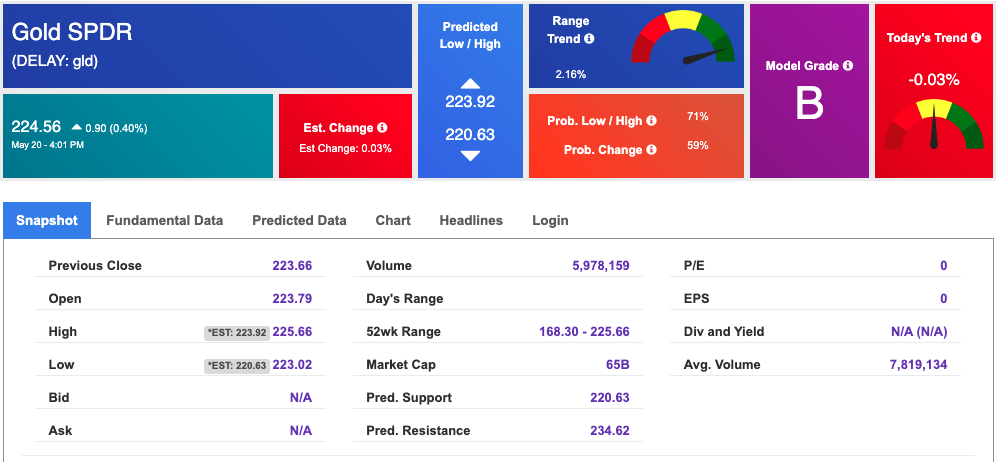
Using SPDR GOLD TRUST (GLD) as a tracker in our Stock Forecast Tool, the 10-day prediction window shows mixed signals. The gold proxy is trading at $224.56 at the time of publication. Vector signals show -0.03% for today. Prediction data is uploaded after the market close at 6 p.m., CST. Today’s data is based on market signals from the previous trading session.
The yield on the 10-year Treasury note is up at 4.450% at the time of publication.
The yield on the 30-year Treasury note is up at 4.586% at the time of publication.
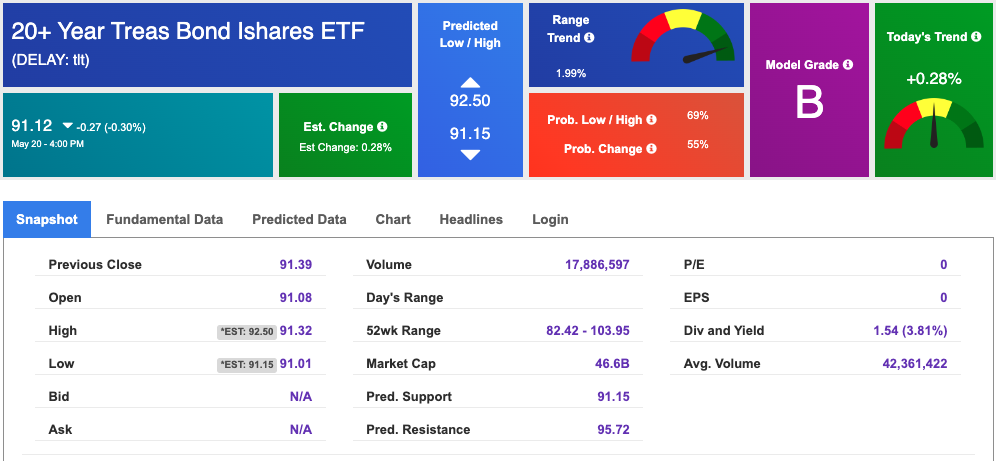
Using the iShares 20+ Year Treasury Bond ETF (TLT) as a proxy for bond prices in our Stock Forecast Tool, we see mixed signals in our 10-day prediction window. Prediction data is uploaded after the market close at 6 p.m., CST. Today’s data is based on market signals from the previous trading session.
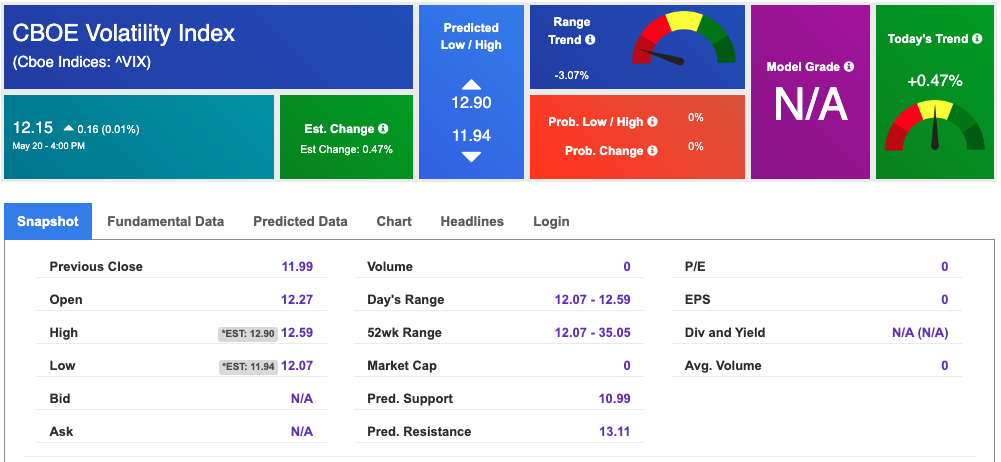
The CBOE Volatility Index (^VIX) is priced at $12.15 up 0.01% at the time of publication, and our 10-day prediction window shows mixed signals. Prediction data is uploaded after the market close at 6 p.m., CST. Today’s data is based on market signals from the previous trading session.
Please share this Tradespoon Market Commentary with your friends.
![]()

![]()
Comments Off on


Tradespoon Tools make finding winning trades in minute as easy as 1-2-3.
Our simple 3 step approach has resulted in an average return of almost 20% per trade!

