 Special Offer: Try the 'Forecast Toolbox Membership' for ONLY $37!
CLICK HERE TO LEARN MORE
Special Offer: Try the 'Forecast Toolbox Membership' for ONLY $37!
CLICK HERE TO LEARN MORE
The stock market opened the week on a positive note, with both the Nasdaq and S&P 500 continuing their upward momentum from the previous week. The Nasdaq has successfully exited correction territory, signaling renewed investor confidence. The rally comes at a crucial time as market participants brace for significant economic data and insights from the Federal Reserve.
This week, all eyes are on the Federal Reserve, with the July Federal Open Market Committee (FOMC) meeting minutes set to be released on Wednesday. However, the most anticipated event is Fed Chair Jerome Powell’s speech at the Jackson Hole Economic Symposium on Friday. Market sentiment is leaning towards a potential 25 basis point interest rate cut in September, with the possibility of a 50 basis point cut not entirely ruled out. Powell’s speech will be closely watched for clues on the Fed’s policy direction, especially in light of the recent inflation data.
Last week’s key economic reports provided mixed signals about inflation. The Consumer Price Index (CPI) for July showed a 2.9% year-over-year increase, slightly below the expected 3%, marking the smallest annual rise in inflation since March 2021. On a monthly basis, headline inflation rose by 0.2%, while core inflation, which excludes volatile food and energy prices, also increased by 0.2% month-over-month and 3.2% year-over-year. These figures suggest that inflationary pressures may be easing, giving the Federal Reserve more room to consider potential rate cuts.
Following the CPI release, the Producer Price Index (PPI) data further supported the narrative of cooling inflation. The PPI, which measures wholesale prices, rose by just 0.1% in July, down from June’s 0.2% increase and below the anticipated 0.2% gain. Core PPI remained unchanged, indicating a slowdown in wholesale price pressures. These developments have fueled speculation that the Fed may be more inclined to pursue interest rate cuts, aligning with the growing soft landing narrative.
As the market rallies today, traders are breathing a sigh of relief. After several weeks of volatility, attention is now focused on the Jackson Hole Economic Symposium, where Fed Chair Powell’s address is expected to set the tone for the coming months. With U.S. futures pointing upwards, the market is looking for direction, and Powell’s speech on Friday is anticipated to confirm a dovish stance, potentially setting the stage for a rate cut in September. Last week, all three major indexes posted their best performances of 2024, driven by strong inflation, retail sales, and jobless claims data.
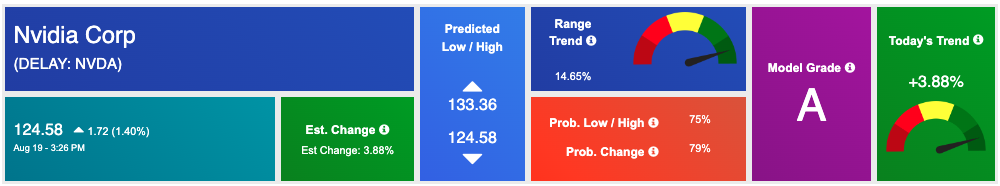
In tandem with the broader market rally, Nvidia has been a standout performer. With its earnings report just around the corner, Nvidia shares have surged, rising 3% today and marking a six-day streak that has seen the stock gain 23%. Nvidia has been the most actively traded stock in both the S&P 500 and Nasdaq 100, with investors eagerly awaiting its quarterly earnings report on August 28. The company’s strong performance is a key indicator of the tech sector’s resilience amid broader market fluctuations.
Oil prices dipped on Monday following U.S. Secretary of State Anthony Blinken’s visit to Tel Aviv to discuss a ceasefire between Israel and Hamas. Brent crude fell 0.5% to just over $79 a barrel, while the West Texas Intermediate (WTI) benchmark dropped 0.7% to about $76 a barrel. The geopolitical situation in the Middle East remains a significant driver of oil prices, and any developments in the region are likely to impact the market.
Meanwhile, the U.S. Dollar Index, which measures the greenback against a basket of six major currencies, fell to its lowest level in five months. This decline is driven by expectations that the Fed may soon begin easing its monetary policy. The yield on the 10-year Treasury note remained steady at 3.867% early Monday, while the 2-year note yield stood at 4.049%, reflecting cautious optimism in the bond market as traders await more definitive signals from the Fed.
As the week progresses, the market is likely to remain volatile, with a focus on the FOMC minutes and Powell’s Jackson Hole speech. While inflation data and earnings reports suggest a softer economic landscape, I remain in the market-neutral camp. The risk of an economic slowdown persists, with rising unemployment and potential failures among small banks weighing on investor sentiment.
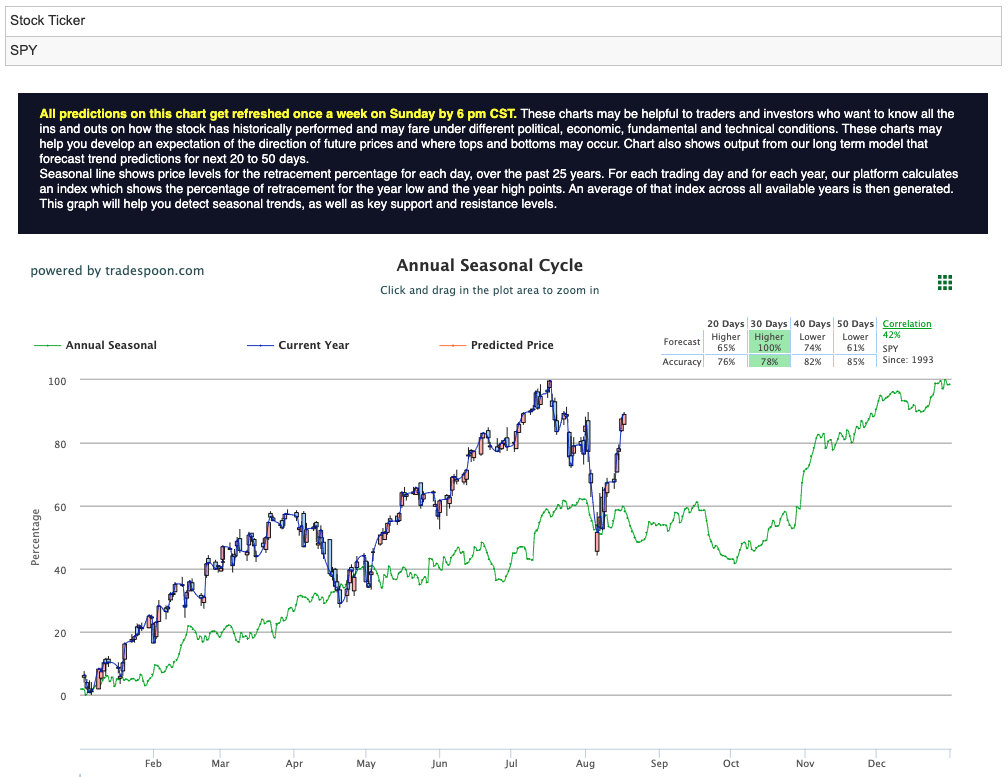
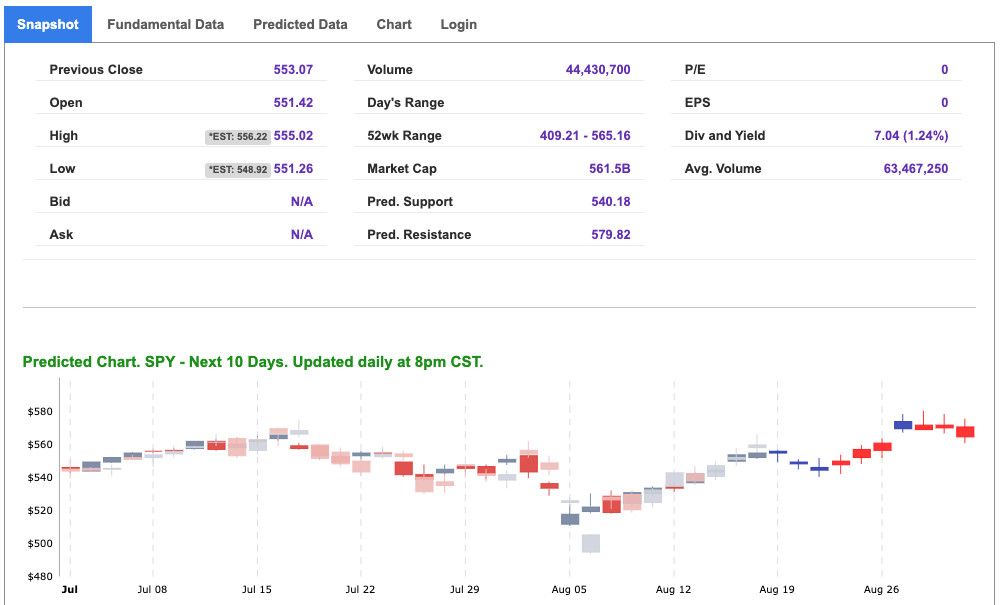
For the S&P 500 (SPY), the rally appears capped at the $560–$575 level, with short-term support in the $480–$510 range over the coming months. Expect the market to trade sideways in the short to medium term, although the long-term uptrend remains intact. Traders should remain cautious, balancing their strategies as they navigate through ongoing economic shifts and potential opportunities. For reference, the SPY Seasonal Chart is shown below:
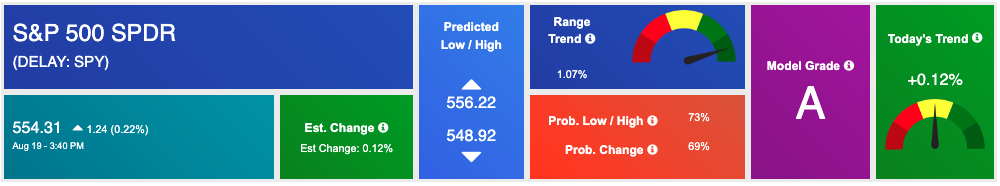
Using the “SPY” symbol to analyze the S&P 500 our 10-day prediction window shows a near-term positive outlook. Prediction data is uploaded after the market closes at 6 p.m. CST. Today’s data is based on market signals from the previous trading session.
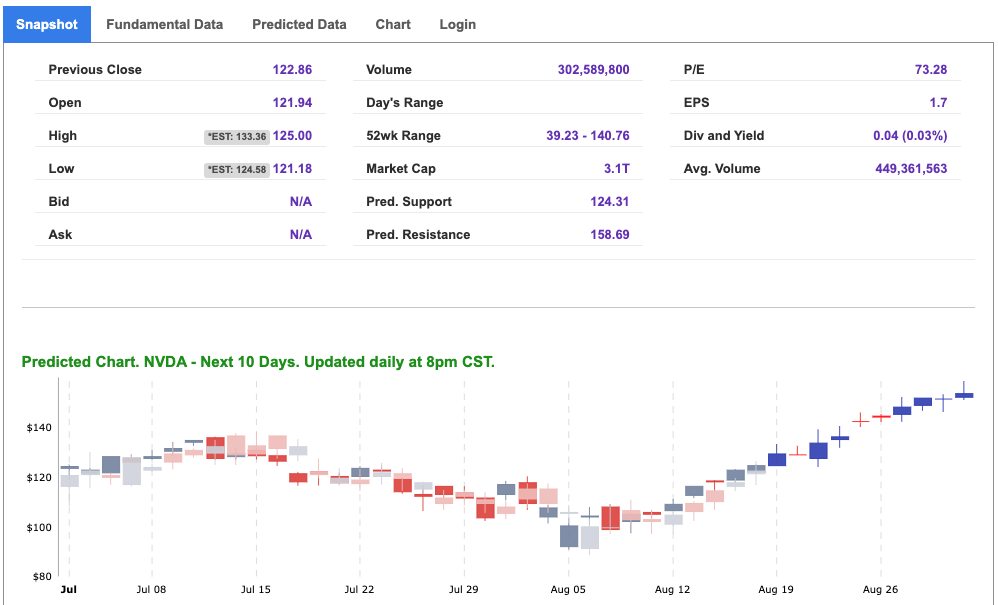
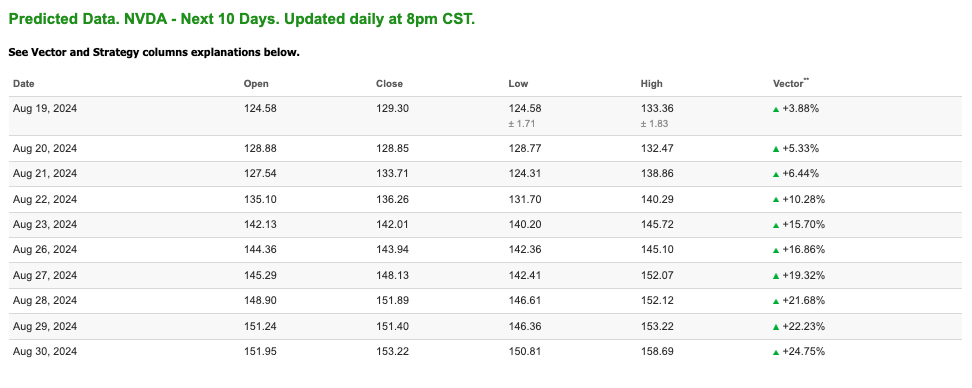
Note: The Vector column calculates the change of the Forecasted Average Price for the next trading session relative to the average of actual prices for the last trading session. The column shows the expected average price movement “Up or Down”, in percent. Trend traders should trade along the predicted direction of the Vector. The higher the value of the Vector the higher its momentum.
*Please note: At the time of publication Vlad Karpel does have a position in the featured symbol, nvda. Our featured symbol is part of your free subscription service. It is not included in any paid Tradespoon subscription service. Vlad Karpel only trades his money in paid subscription services. If you are a paid subscriber, please review your Premium Member Picks, ActiveTrader, or MonthlyTrader recommendations. If you are interested in receiving Vlad’s picks, please click here.
West Texas Intermediate for Crude Oil delivery (CL.1) is priced at $74.46 per barrel, down 2.86%, at the time of publication.
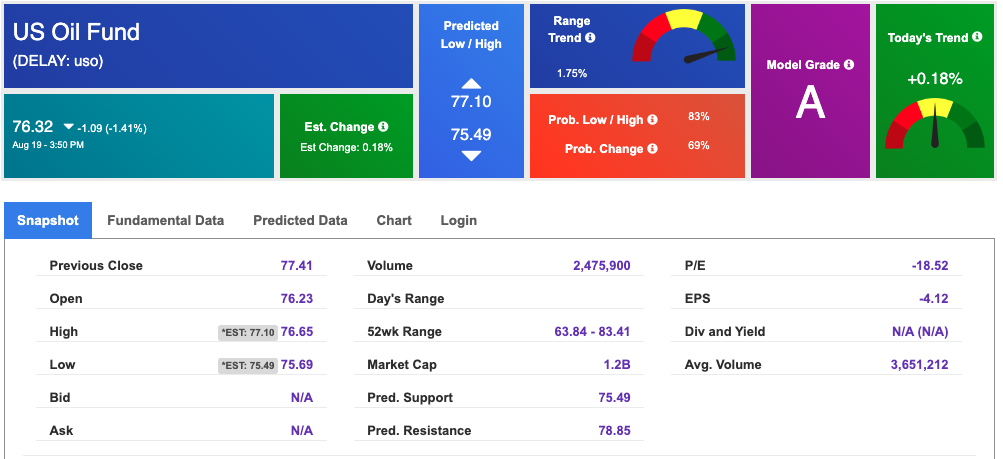
Looking at USO, a crude oil tracker, our 10-day prediction model shows mixed signals. The fund is trading at $76.32 at the time of publication. Prediction data is uploaded after the market close at 6 p.m., CST. Today’s data is based on market signals from the previous trading session.
The price for the Gold Continuous Contract (GC00) is up 0.19% at $2,542.50 at the time of publication.
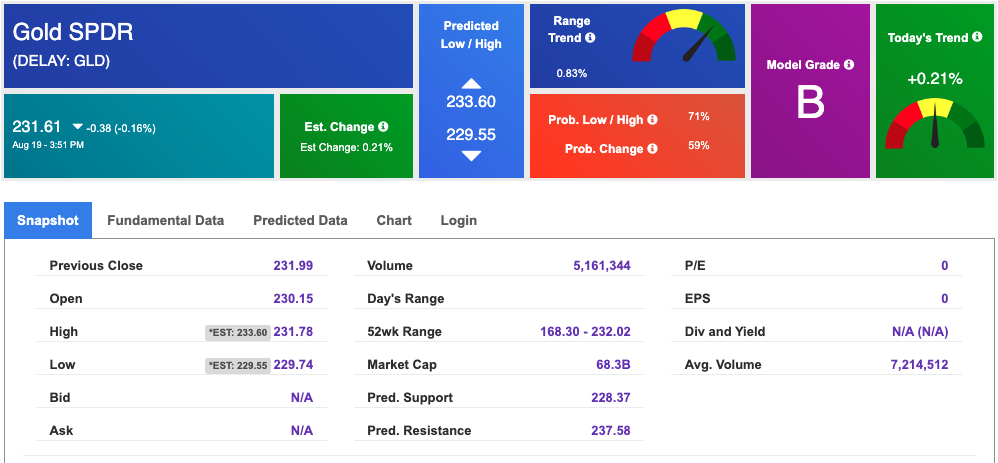
Using SPDR GOLD TRUST (GLD) as a tracker in our Stock Forecast Tool, the 10-day prediction window shows mixed signals. The gold proxy is trading at $231.61 at the time of publication. Vector signals show +0.21% for today. Prediction data is uploaded after the market close at 6 p.m., CST. Today’s data is based on market signals from the previous trading session.
The yield on the 10-year Treasury note is down at 3.876% at the time of publication.
The yield on the 30-year Treasury note is down at 4.125% at the time of publication.
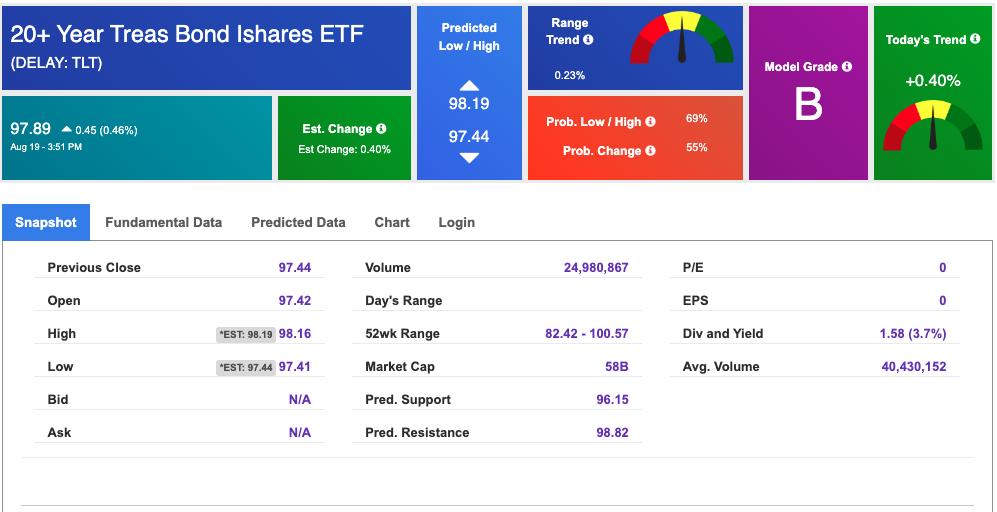
Using the iShares 20+ Year Treasury Bond ETF (TLT) as a proxy for bond prices in our Stock Forecast Tool, we see mixed signals in our 10-day prediction window. Prediction data is uploaded after the market close at 6 p.m., CST. Today’s data is based on market signals from the previous trading session.
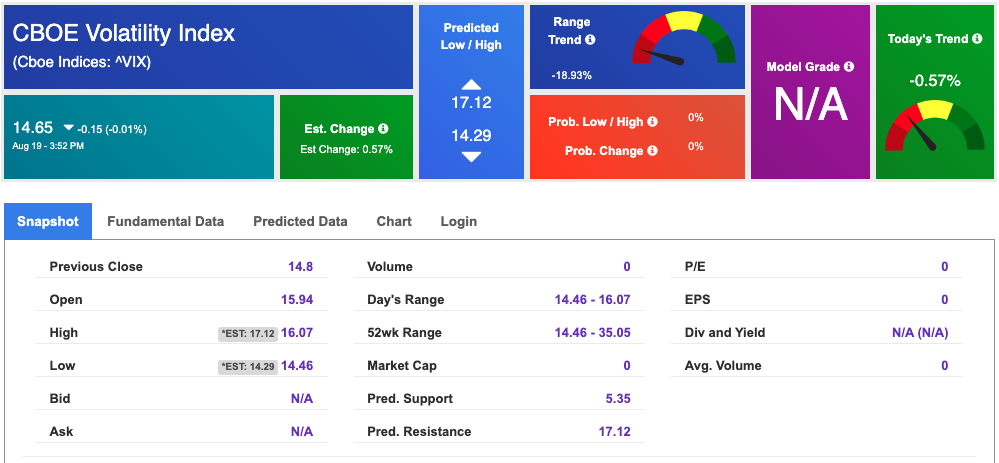
The CBOE Volatility Index (^VIX) is priced at $14.65 down 0.01% at the time of publication, and our 10-day prediction window shows mixed signals. Prediction data is uploaded after the market close at 6 p.m., CST. Today’s data is based on market signals from the previous trading session.
Please share this Tradespoon Market Commentary with your friends.
![]()

![]()
Comments Off on


Tradespoon Tools make finding winning trades in minute as easy as 1-2-3.
Our simple 3 step approach has resulted in an average return of almost 20% per trade!

