 Special Offer: Try the 'Picks Membership' for ONLY $37!
CLICK HERE TO LEARN MORE
Special Offer: Try the 'Picks Membership' for ONLY $37!
CLICK HERE TO LEARN MORE
The shortened trading week for U.S. markets, coinciding with the start of Q3, began on a cautiously optimistic note as all three major indices opened in the green. Despite early gains, stocks encountered midday turbulence before ultimately closing with modest gains. The day’s trading was marked by significant movements in response to key economic indicators and geopolitical developments.
A notable report from The Institute for Supply Management revealed that the Purchasing Managers Index (PMI) fell to 48.5 in June, below economists’ expectations of 49.1. This marked the third consecutive month of contraction, underscoring ongoing challenges within the manufacturing sector. A PMI reading below 50 typically indicates a contraction in manufacturing activity, prompting investor concerns about the broader economic outlook.
Meanwhile, the 10-year Treasury yield saw a notable spike, reaching 4.481%. This increase continued a trend that began following recent geopolitical developments and speculation about future economic policies, particularly surrounding the upcoming U.S. presidential elections. The rising yield reflects heightened investor expectations and potential adjustments in monetary policy moving forward.
Looking ahead, market focus turns to upcoming employment data scheduled for release midweek. Analysts anticipate the report will provide crucial insights into the labor market’s health and its implications for economic growth. S&P Global Ratings forecasts a moderate addition of 200,000 jobs in June, slightly below the previous month’s pace, suggesting a potential moderation in job market dynamics.
Last week’s market rally was supported by favorable Personal Consumption Expenditures (PCE) data, a key inflation gauge for the Federal Reserve. The PCE price index, which remained unchanged in May, indicated stable inflation trends, providing reassurance amidst ongoing economic adjustments.
In Europe, market sentiment varied as inflation trends diverged across major economies throughout June. Countries like France and Spain experienced moderated inflation rates, while Italy saw a modest increase in price levels. These variations influenced European market dynamics, contributing to mixed trading sessions amid global economic uncertainties.
Looking forward, market participants brace for heightened volatility as the quarter-end approaches, exacerbated by factors such as the upcoming Russell 2000 rebalancing and fluctuating Treasury yields. Geopolitical tensions and evolving economic indicators are expected to continue shaping investor sentiment, highlighting the importance of a nuanced and adaptable investment strategy in navigating current market conditions.
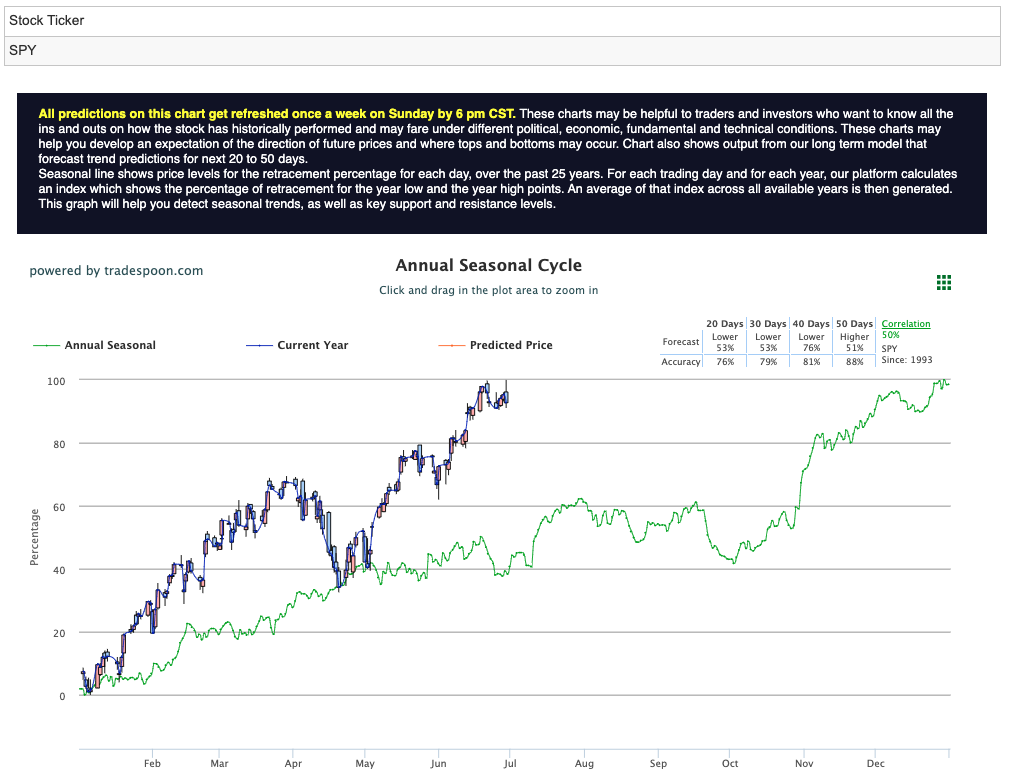
As we approach the midpoint of 2024, financial markets have responded to significant inflation figures, influencing investor sentiment amid ongoing market highs. The SPY rally is anticipated to encounter resistance between $550 and $560, with short-term support seen around $520 to $530. This forecast reflects cautious optimism for sustained upward momentum, projecting continued highs and higher lows in the near term. For reference, the SPY Seasonal Chart is shown below:
In summary, while early market gains and economic indicators offered a glimmer of hope, persistent geopolitical uncertainties and economic signals indicate a complex and potentially volatile road ahead. Investors should remain attentive and well-informed as market dynamics evolve alongside global developments.
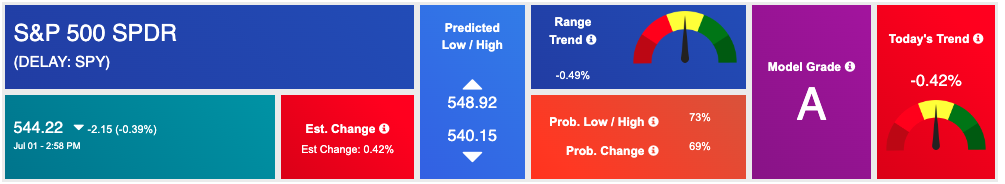
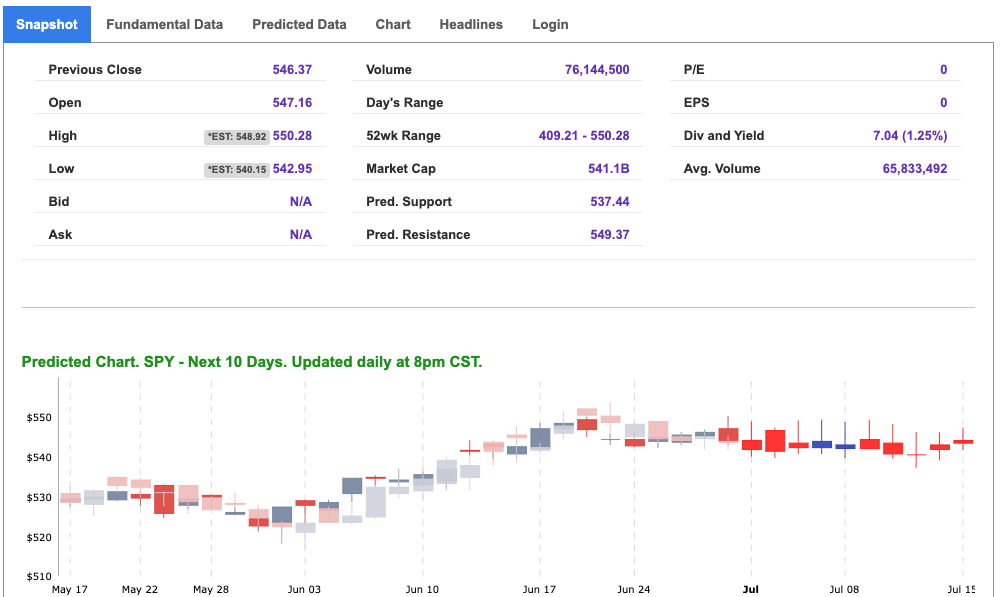
Using the “SPY” symbol to analyze the S&P 500 our 10-day prediction window shows a near-term positive outlook. Prediction data is uploaded after the market closes at 6 p.m. CST. Today’s data is based on market signals from the previous trading session.
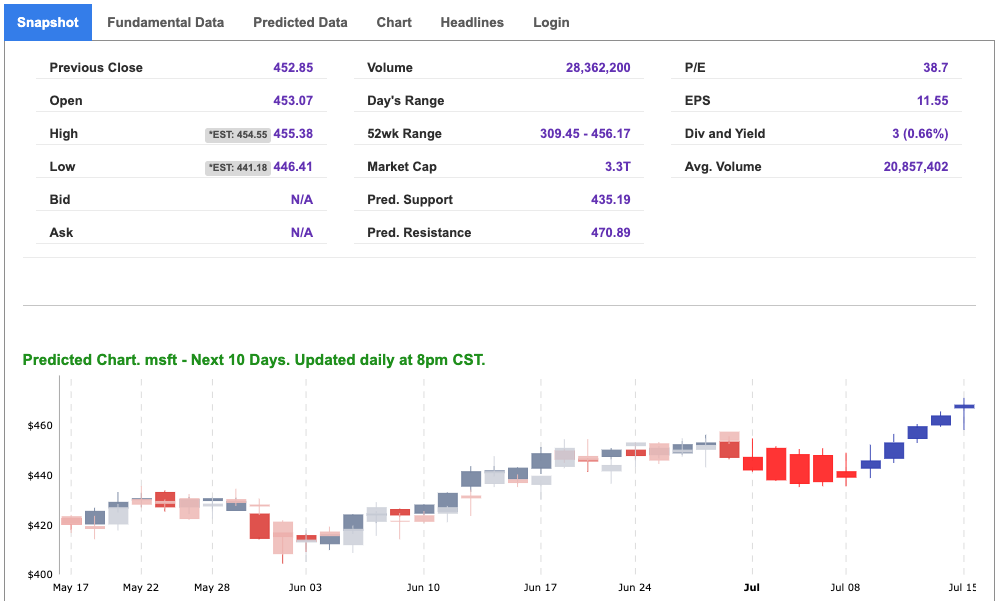
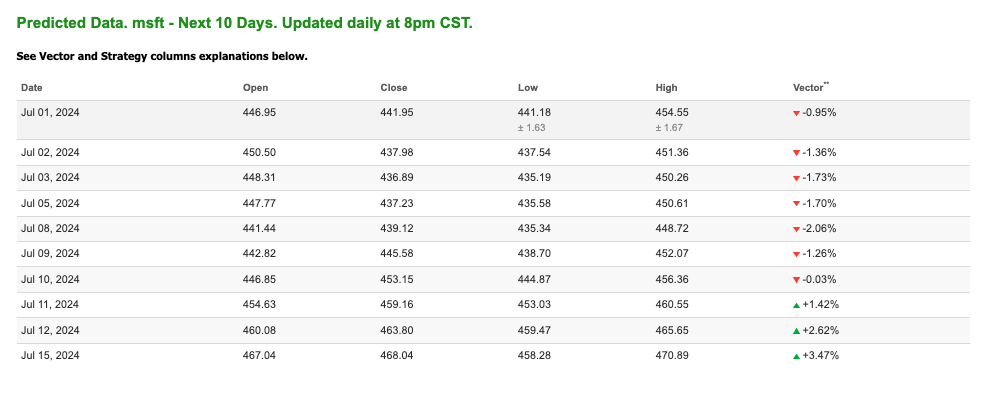
Note: The Vector column calculates the change of the Forecasted Average Price for the next trading session relative to the average of actual prices for the last trading session. The column shows the expected average price movement “Up or Down”, in percent. Trend traders should trade along the predicted direction of the Vector. The higher the value of the Vector the higher its momentum.
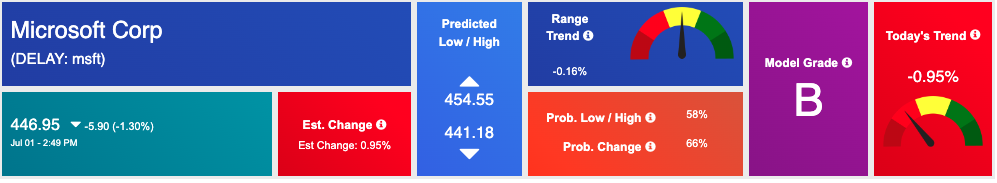
*Please note: At the time of publication Vlad Karpel does have a position in the featured symbol, MSFT. Our featured symbol is part of your free subscription service. It is not included in any paid Tradespoon subscription service. Vlad Karpel only trades his money in paid subscription services. If you are a paid subscriber, please review your Premium Member Picks, ActiveTrader, or MonthlyTrader recommendations. If you are interested in receiving Vlad’s picks, please click here.
West Texas Intermediate for Crude Oil delivery (CL.1) is priced at $83.46 per barrel, up 2.35%, at the time of publication.
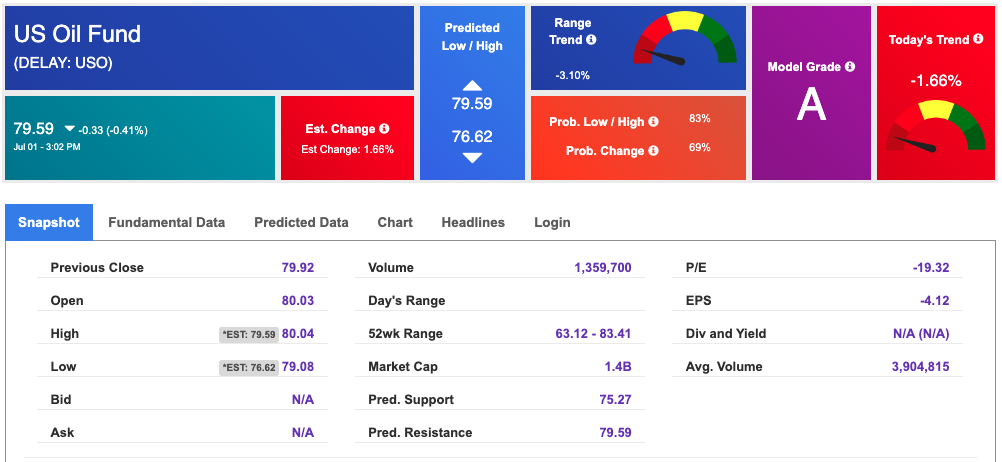
Looking at USO, a crude oil tracker, our 10-day prediction model shows mixed signals. The fund is trading at $79.59 at the time of publication. Prediction data is uploaded after the market close at 6 p.m., CST. Today’s data is based on market signals from the previous trading session.
The price for the Gold Continuous Contract (GC00) is up 0.12% at $2342.30 at the time of publication.
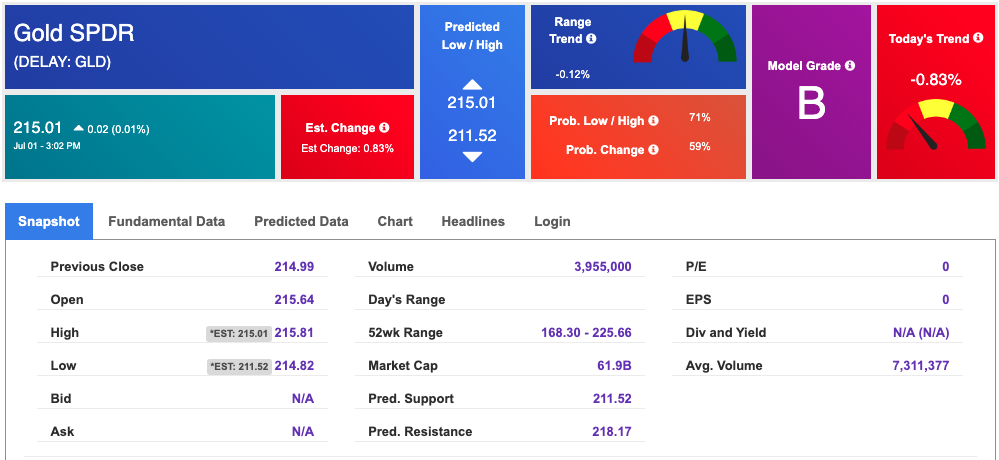
Using SPDR GOLD TRUST (GLD) as a tracker in our Stock Forecast Tool, the 10-day prediction window shows mixed signals. The gold proxy is trading at $215.01 at the time of publication. Vector signals show -0.83% for today. Prediction data is uploaded after the market close at 6 p.m., CST. Today’s data is based on market signals from the previous trading session.
The yield on the 10-year Treasury note is up at 4.472% at the time of publication.
The yield on the 30-year Treasury note is up at 4.633% at the time of publication.
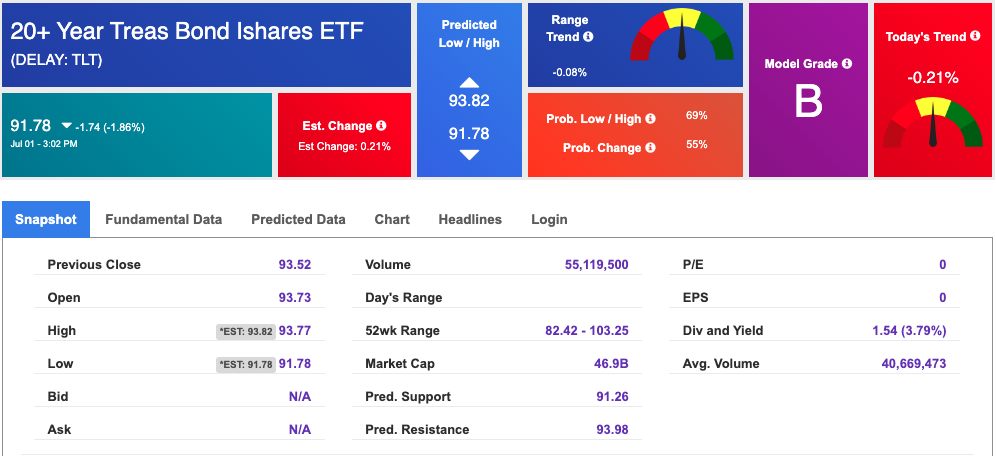
Using the iShares 20+ Year Treasury Bond ETF (TLT) as a proxy for bond prices in our Stock Forecast Tool, we see mixed signals in our 10-day prediction window. Prediction data is uploaded after the market close at 6 p.m., CST. Today’s data is based on market signals from the previous trading session.
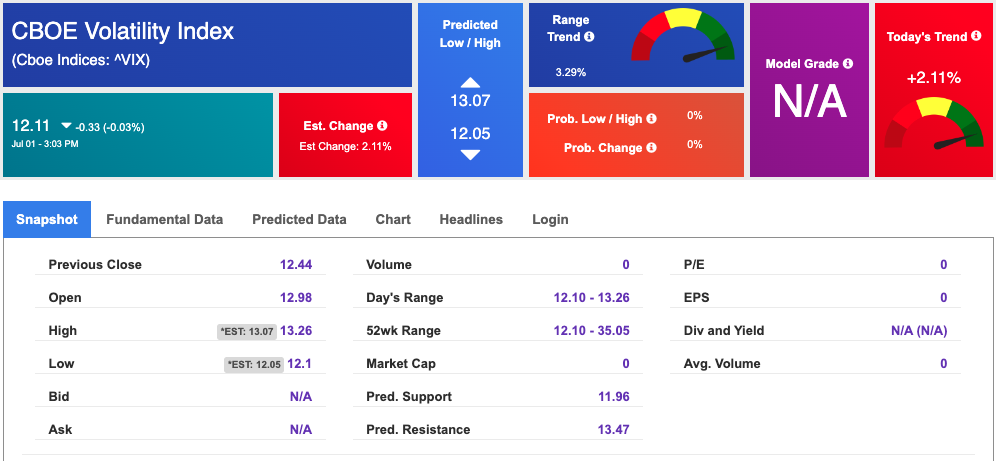
The CBOE Volatility Index (^VIX) is priced at $12.11 down 0.03% at the time of publication, and our 10-day prediction window shows mixed signals. Prediction data is uploaded after the market close at 6 p.m., CST. Today’s data is based on market signals from the previous trading session.
Please share this Tradespoon Market Commentary with your friends.
![]()

![]()
Comments Off on


Tradespoon Tools make finding winning trades in minute as easy as 1-2-3.
Our simple 3 step approach has resulted in an average return of almost 20% per trade!