 Special Offer: Try the 'Premium Membership' for ONLY $37!
CLICK HERE TO LEARN MORE
Special Offer: Try the 'Premium Membership' for ONLY $37!
CLICK HERE TO LEARN MORE
The stock market attempted a comeback on Monday after an early selloff, but it wasn’t enough to salvage the quarter. The S&P 500 and Nasdaq Composite snapped a five-quarter winning streak, with all three major indexes closing the first quarter of 2025 in the red. The declines marked the sharpest quarterly losses for the S&P 500 and Nasdaq since 2022, underscoring a shift in investor sentiment amid economic uncertainty and policy risks.
Riskier assets and high-growth technology stocks bore the brunt of the selloff, struggling even as the broader market rebounded. The tech-heavy Nasdaq Composite saw the steepest pullback, weighed down by sector-specific challenges and broader concerns about the economy. Consumer discretionary stocks also lagged behind, reflecting cautious consumer sentiment.
In contrast, defensive sectors such as consumer staples, financials, energy, real estate, and utilities saw relative strength. The CBOE Volatility Index (VIX), often referred to as Wall Street’s fear gauge, remained elevated at 22.42—down from a morning high of 24.80—signaling persistent market jitters despite some dip-buying activity.
Looking ahead, market sentiment remains fragile as investors brace for new tariff announcements from the White House on April 2. The anticipation of expanded import taxes has weighed heavily on stock-index futures, with selling pressure persisting into the final session of Q1. The concern is that higher tariffs could fuel inflationary pressures while dampening economic growth—a classic stagflationary scenario that has historically been difficult for the Federal Reserve to manage.
Recent economic surveys have only added to these concerns. The latest data pointed to signs of stagflation, where prices continue to rise even as economic growth stagnates. The impact was evident in Treasury yields, which, despite a modest rebound, remain on track for a sharp quarterly decline. This suggests investors are hedging against heightened risks of an economic slowdown.
Economic data releases this week will provide critical insights into the health of the economy. The Chicago Business Barometer PMI unexpectedly rose in March to 47.6, up from February’s 45.5, defying expectations of a decline. However, regional data painted a more mixed picture, with the Texas Manufacturing Outlook Survey’s business activity index dropping to -16.3 from -8.3. Despite this, Texas’ production index expanded in March after contracting in February.
Investors will closely watch key data points throughout the week:
The past week encapsulated the broader market’s struggles, with sentiment shifting rapidly between optimism and caution. Early gains, led by consumer discretionary stocks such as Tesla, were overshadowed by mounting concerns over tariffs and economic fragility. While corporate earnings exceeded expectations in many sectors, the dominant headwinds—higher interest rates and rising unemployment—kept pressure on equities.
The S&P 500 (SPY) has been grappling with resistance in the $580–$600 range, while key support levels remain between $530–$550. The market remains in a sideways pattern, with inflation data aligning with expectations and earnings outperforming forecasts. For reference, the SPY Seasonal Chart is shown below:
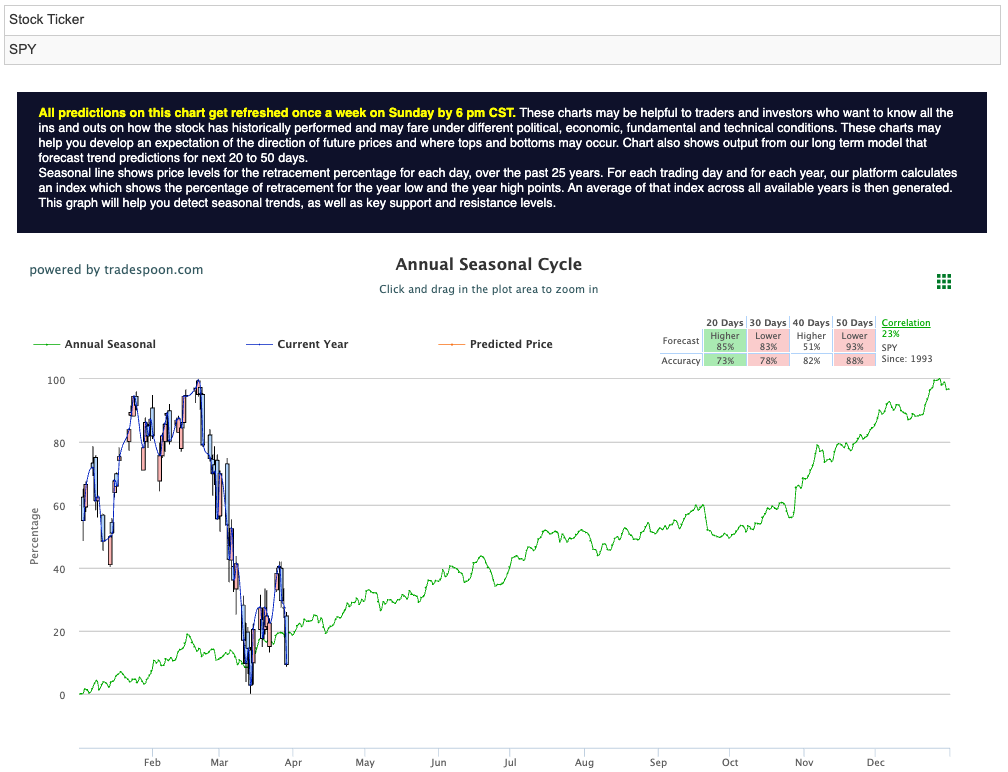
However, persistent fears of prolonged high interest rates and economic deceleration continue to cloud the long-term outlook. In the short term, further consolidation appears likely as investors digest policy developments and economic indicators.
With Q2 now underway, market participants will closely monitor economic data and policy decisions to gauge the direction of the economy. If tariffs exacerbate inflationary pressures and further dampen growth, the Federal Reserve’s response will be critical in shaping market trajectory. Until clarity emerges, volatility is likely to remain a defining feature of the markets in the months ahead.
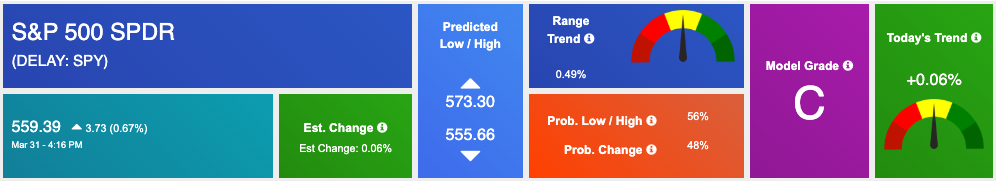
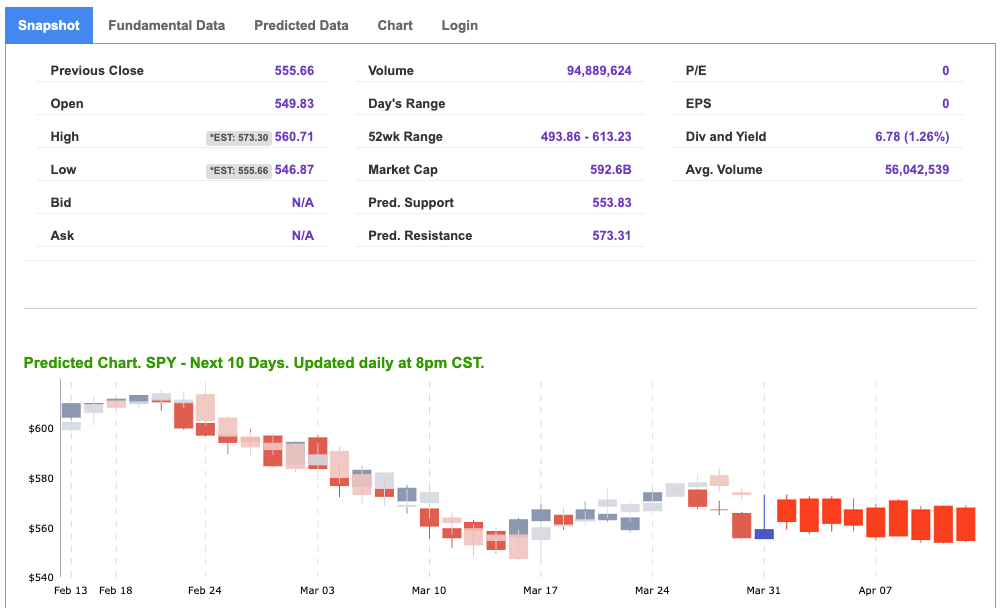
Using the “SPY” symbol to analyze the S&P 500 our 10-day prediction window shows a near-term positive outlook. Prediction data is uploaded after the market closes at 6 p.m. CST. Today’s data is based on market signals from the previous trading session.
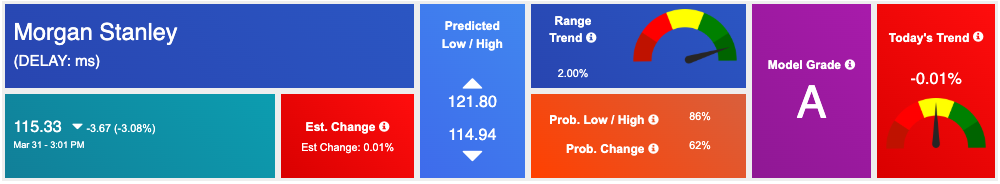
Our featured symbol for Tuesday is MS. Morgan Stanley – MS is showing a steady vector in our Stock Forecast Toolbox’s 10-day forecast.
The symbol is trading at $115.33 with a vector of -0.01% at the time of publication.
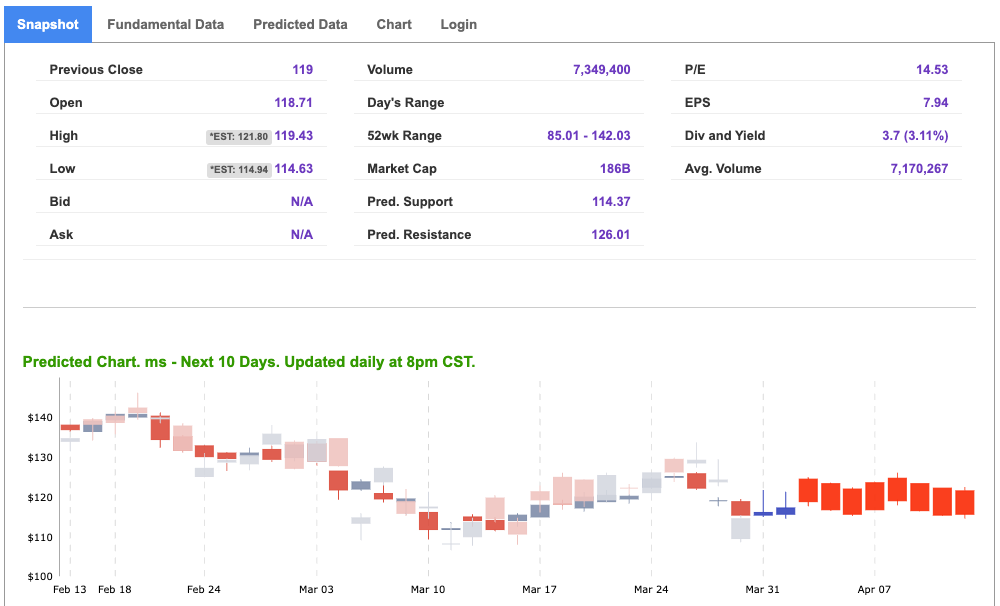
10-Day Prediction data is uploaded after the market close at 6 p.m., CST. Today’s data is based on market signals from the previous trading session.
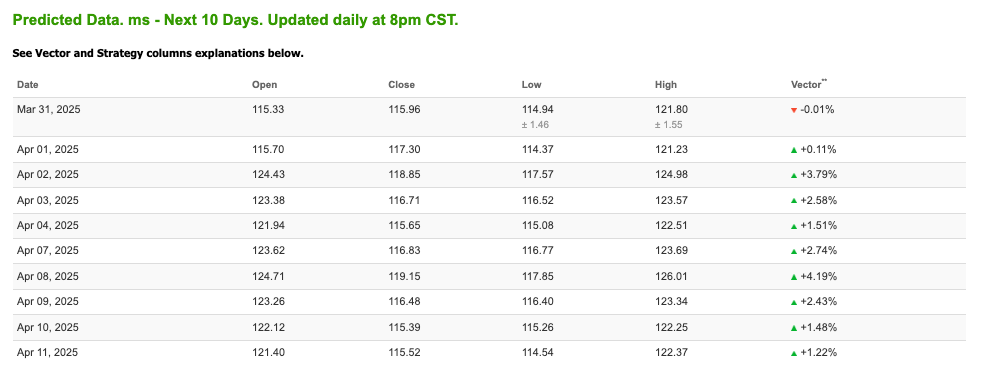
Note: The Vector column calculates the change of the Forecasted Average Price for the next trading session relative to the average of actual prices for the last trading session. The column shows the expected average price movement “Up or Down”, in percent. Trend traders should trade along the predicted direction of the Vector. The higher the value of the Vector the higher its momentum.
*Please note: At the time of publication Vlad Karpel does have a position in the featured symbol, MS. Our featured symbol is part of your free subscription service. It is not included in any paid Tradespoon subscription service. Vlad Karpel only trades his money in paid subscription services. If you are a paid subscriber, please review your Premium Member Picks, ActiveTrader, or MonthlyTrader recommendations. If you are interested in receiving Vlad’s picks, please click here.
West Texas Intermediate for Crude Oil delivery (CL.1) is priced at $69.10 per barrel, up 1.20%, at the time of publication.
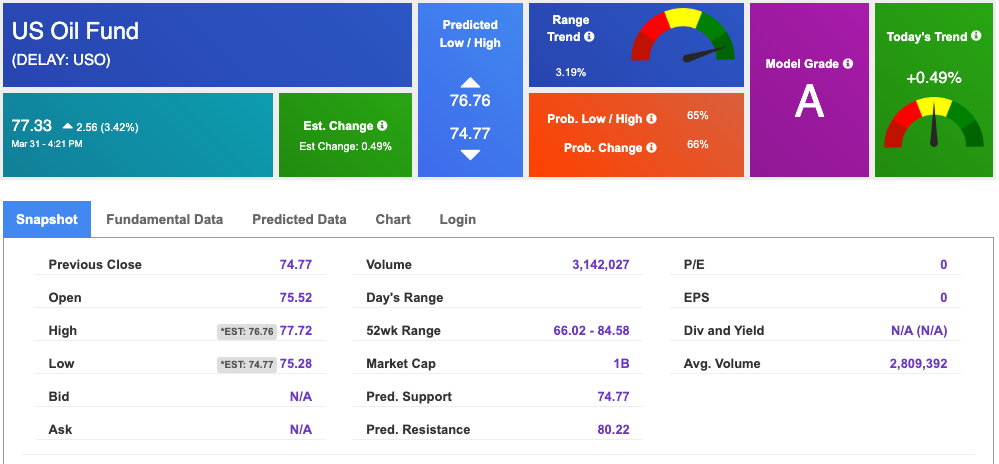
Looking at USO, a crude oil tracker, our 10-day prediction model shows mixed signals. The fund is trading at $77.83 at the time of publication. Prediction data is uploaded after the market close at 6 p.m., CST. Today’s data is based on market signals from the previous trading session.
The price for the Gold Continuous Contract (GC00) is down 0.26% at $3,013.60 at the time of publication.
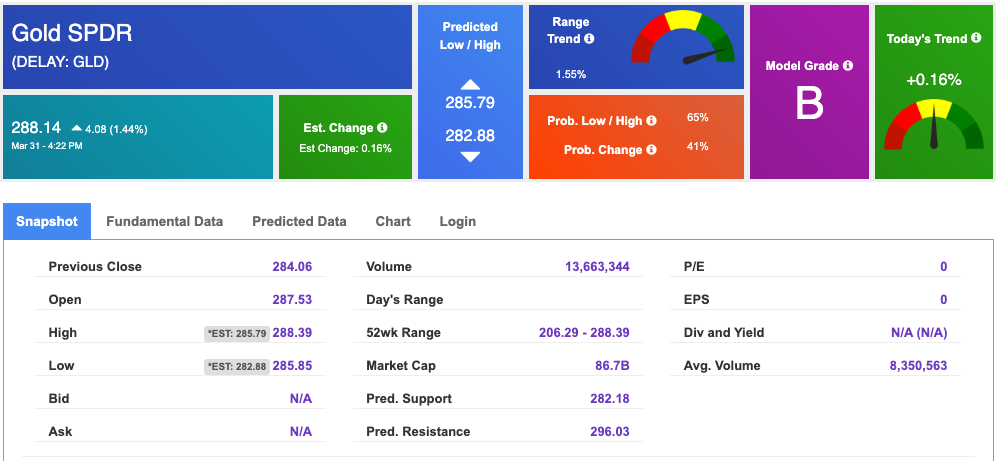
Using SPDR GOLD TRUST (GLD) as a tracker in our Stock Forecast Tool, the 10-day prediction window shows mixed signals. The gold proxy is trading at $288.14 at the time of publication. Vector signals show +0.16% for today. Prediction data is uploaded after the market close at 6 p.m., CST. Today’s data is based on market signals from the previous trading session.
The yield on the 10-year Treasury note is down at 4.210% at the time of publication.
The yield on the 30-year Treasury note is down at 4.577% at the time of publication.
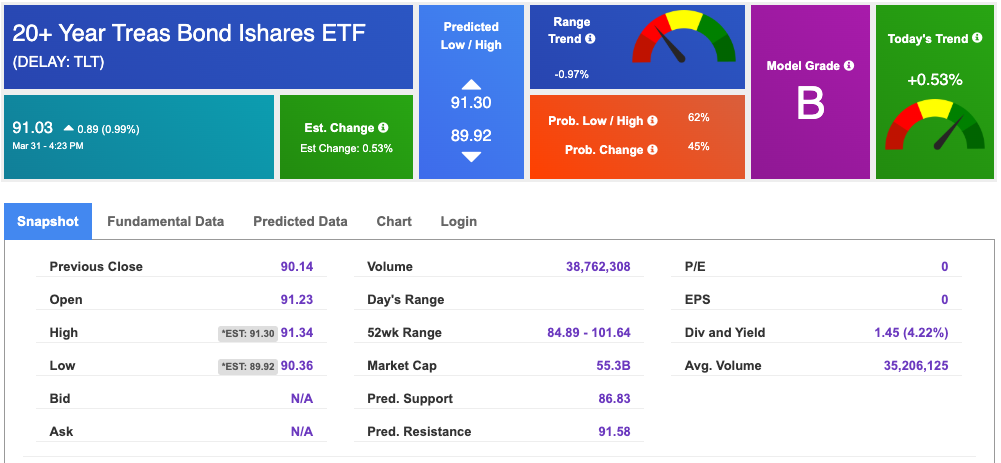
Using the iShares 20+ Year Treasury Bond ETF (TLT) as a proxy for bond prices in our Stock Forecast Tool, we see mixed signals in our 10-day prediction window. Prediction data is uploaded after the market close at 6 p.m., CST. Today’s data is based on market signals from the previous trading session.
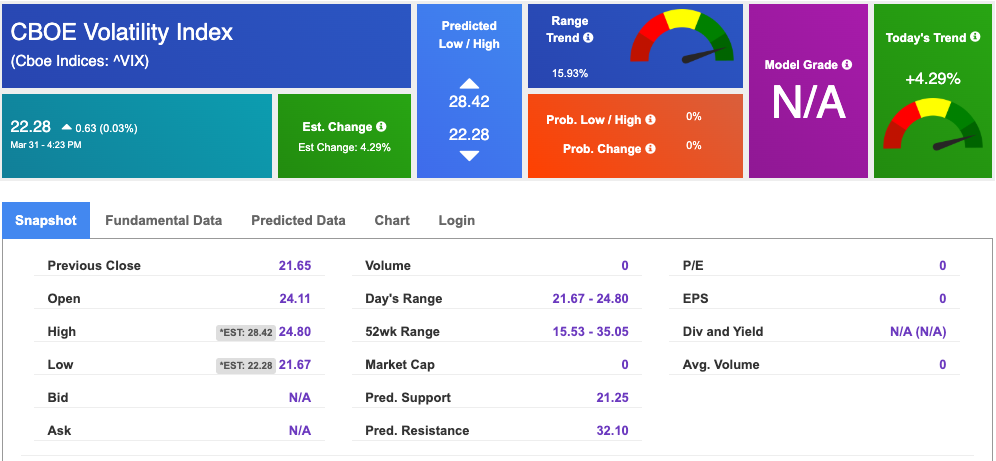
The CBOE Volatility Index (^VIX) is priced at $22.28 down 4.29% at the time of publication, and our 10-day prediction window shows mixed signals. Prediction data is uploaded after the market close at 6 p.m., CST. Today’s data is based on market signals from the previous trading session.
Please share this Tradespoon Market Commentary with your friends.
![]()

![]()
Comments Off on


Tradespoon Tools make finding winning trades in minute as easy as 1-2-3.
Our simple 3 step approach has resulted in an average return of almost 20% per trade!

