 Special Offer: Try the 'RoboInvestor Membership' for ONLY $37!
CLICK HERE TO LEARN MORE
Special Offer: Try the 'RoboInvestor Membership' for ONLY $37!
CLICK HERE TO LEARN MORE
The major stock indexes rallied on Monday, with the S&P 500 and Nasdaq continuing their string of record closes. This performance follows a pivotal week marked by the release of the latest Federal Open Market Committee (FOMC) and Consumer Price Index (CPI)/Producer Price Index (PPI) reports. Notably, markets will be closed on Wednesday, June 19th. Key data reports expected this week include retail sales, housing starts, flash PMI, and additional comments and speeches from Federal Reserve members.
May’s CPI report indicated a slowdown in inflation pressures, remaining unchanged from April on a headline basis, while core CPI increased by a modest 0.2%. These figures eased market concerns and aligned with Federal Reserve expectations. The Fed opted to maintain the benchmark interest rate steady within the 5.25% to 5.50% range, matching market forecasts. Fed officials emphasized a commitment to sustaining higher interest rates for a prolonged period to steer inflation toward a sustainable path back to the 2% target. Chairman Jerome Powell highlighted the delicate balance required to manage inflation, support labor market strength, and foster economic growth. Revised forecasts now anticipate a single quarter-point rate cut by the end of 2024, a notable shift from earlier projections. Inflation, as measured by the CPI, increased at an annual rate of 3.3% in May, slightly down from April’s 3.4% rise.
On Monday, more than two-thirds of the S&P 500 stocks saw gains. The top-performing sectors were consumer discretionary, technology, and industrials. Tesla’s stock helped lift the consumer discretionary sector, while chip stocks boosted the tech sector. The iShares Semiconductor ETF surged higher with contributions from Super Micro Computer and Broadcom, though Nvidia’s stock traded slightly down. Despite this, Nvidia has been receiving more price-target upgrades on Wall Street.
Stocks rallied broadly despite bond yields ticking higher. The 10-year yield rose to 4.277%. In contrast, gold prices fell amid interest rate speculation and a rising dollar. Treasury markets have been extremely volatile as market participants reassess the odds, timing, and magnitude of future rate cuts.
The current market conditions are favorable, with inflation remaining within expected bounds and corporate earnings consistently surpassing forecasts, which supports equity markets. Looking ahead, while the SPY’s potential rally may be capped around $540-$550, there is short-term support at $500-$510. This indicates potential for further market gains amid sustained upward momentum in the coming months. For reference, the SPY Seasonal Chart is shown below:
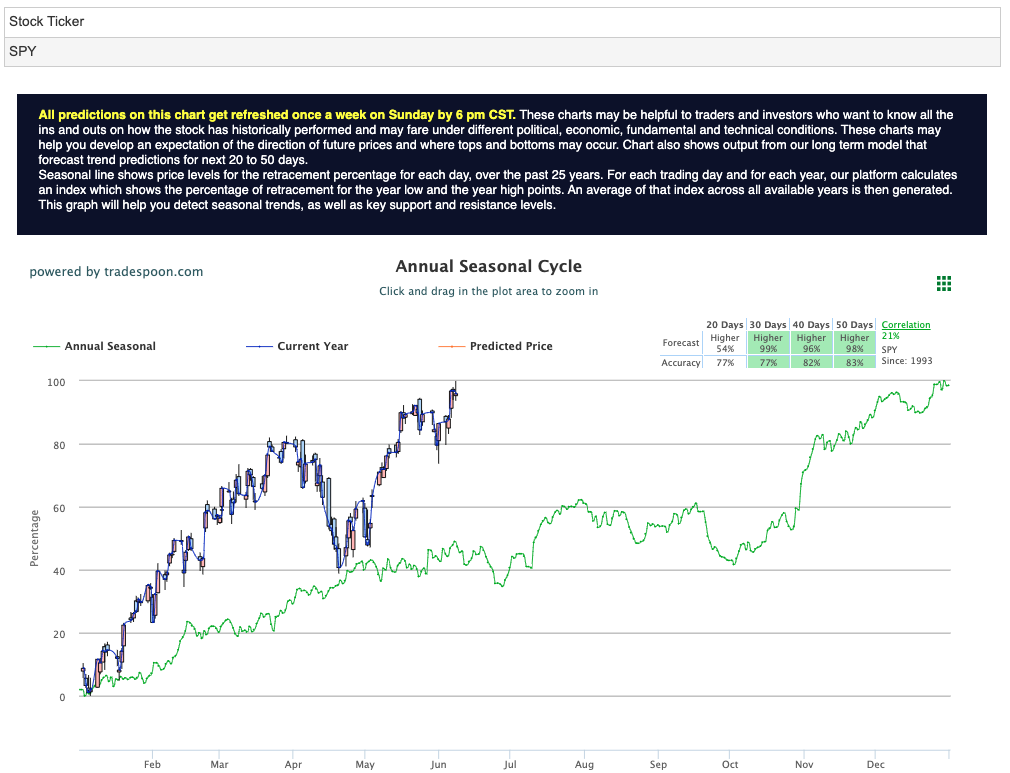
Despite the encouraging market conditions, risks remain, particularly concerning the failure of small banks with exposure to commercial and residential real estate. However, the overall bullish outlook is supported by controlled inflation and robust corporate earnings, suggesting sustained equity market strength in the near term. Investors remain optimistic about potential market gains, with the SPY showing both capped rally potential and strong short-term support levels.
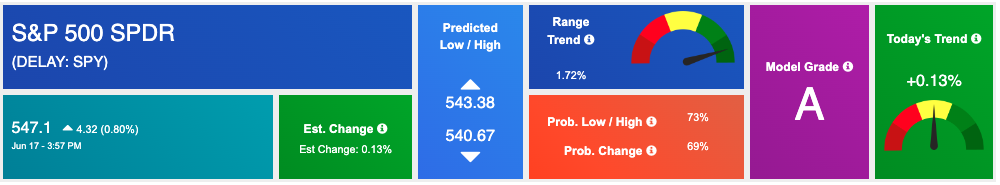
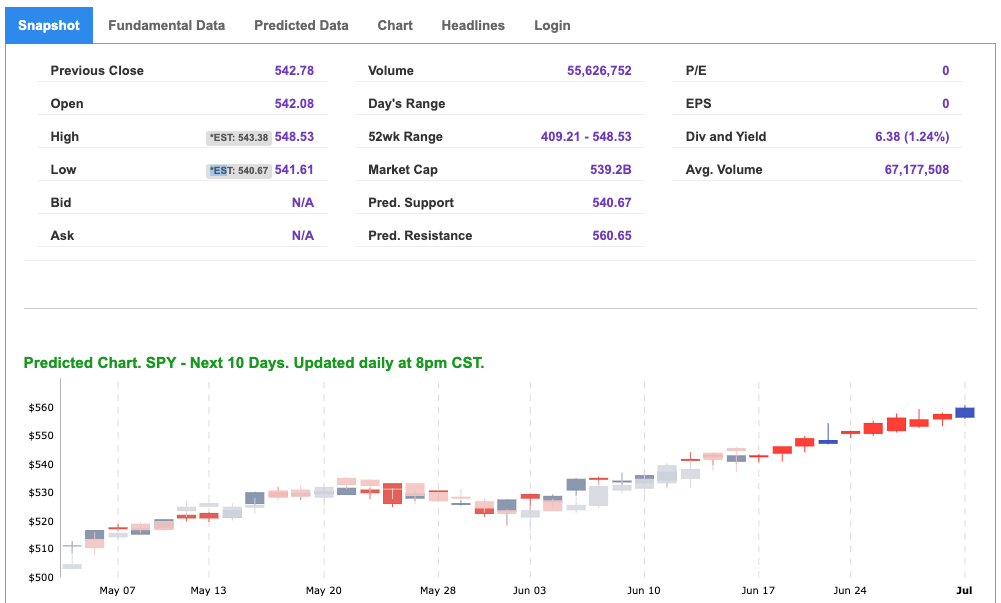
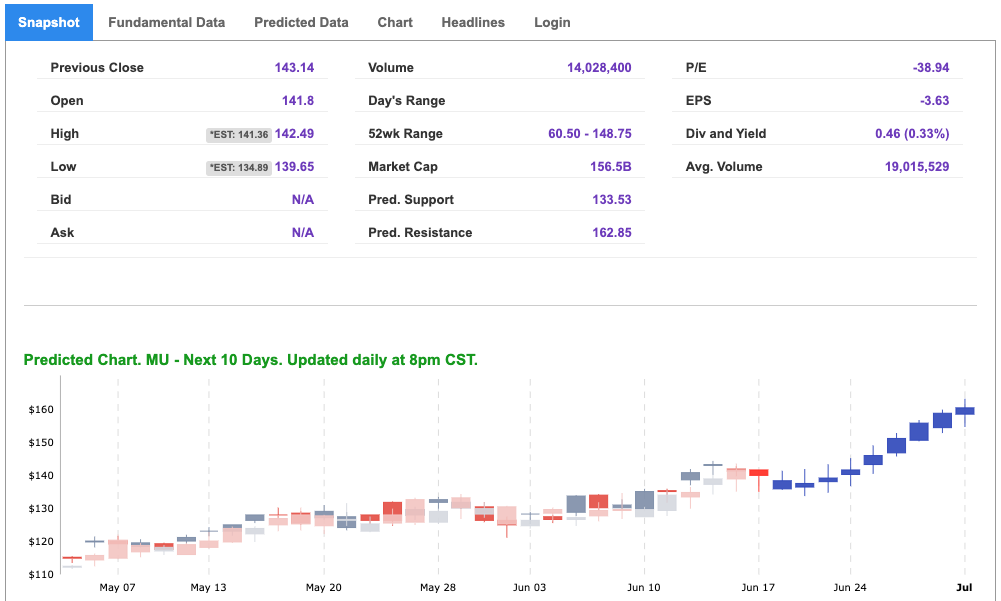
Using the “SPY” symbol to analyze the S&P 500 our 10-day prediction window shows a near-term positive outlook. Prediction data is uploaded after the market closes at 6 p.m. CST. Today’s data is based on market signals from the previous trading session.
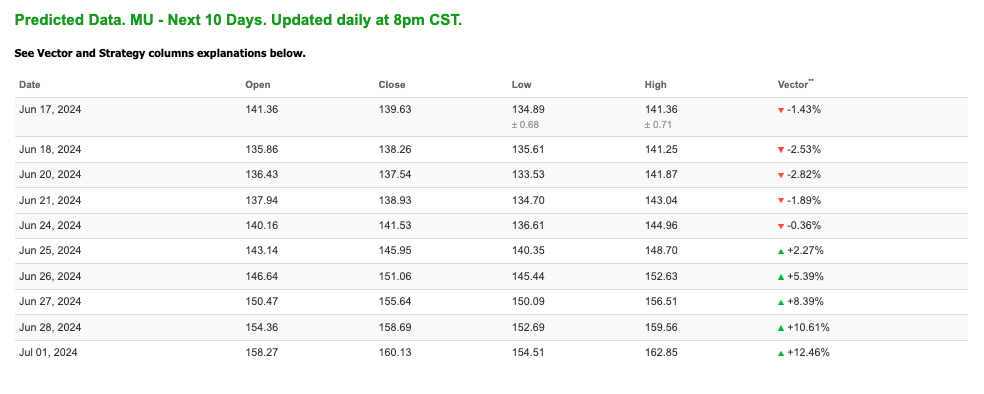
Note: The Vector column calculates the change of the Forecasted Average Price for the next trading session relative to the average of actual prices for the last trading session. The column shows the expected average price movement “Up or Down”, in percent. Trend traders should trade along the predicted direction of the Vector. The higher the value of the Vector the higher its momentum.
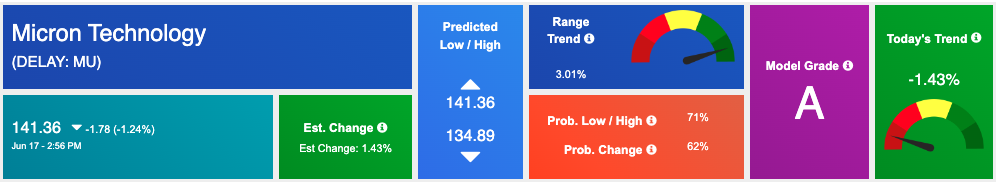
*Please note: At the time of publication Vlad Karpel does have a position in the featured symbol, mu. Our featured symbol is part of your free subscription service. It is not included in any paid Tradespoon subscription service. Vlad Karpel only trades his money in paid subscription services. If you are a paid subscriber, please review your Premium Member Picks, ActiveTrader, or MonthlyTrader recommendations. If you are interested in receiving Vlad’s picks, please click here.
West Texas Intermediate for Crude Oil delivery (CL.1) is priced at $80.60 per barrel, up 2.74%, at the time of publication.
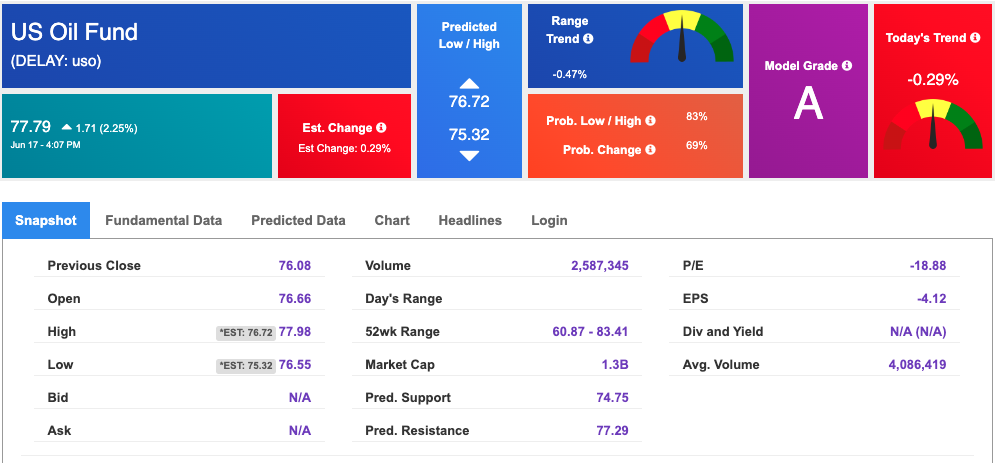
Looking at USO, a crude oil tracker, our 10-day prediction model shows mixed signals. The fund is trading at $77.79 at the time of publication. Prediction data is uploaded after the market close at 6 p.m., CST. Today’s data is based on market signals from the previous trading session.
The price for the Gold Continuous Contract (GC00) is down 0.66% at $2333.70 at the time of publication.
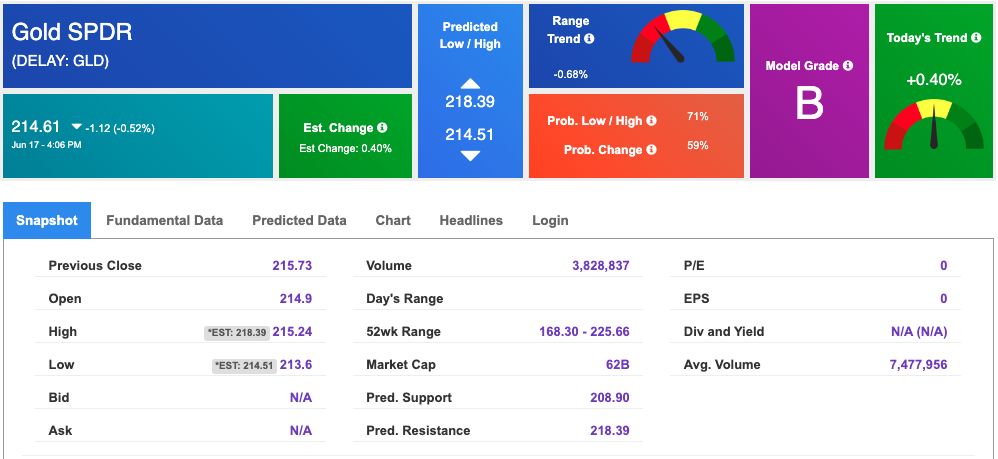
Using SPDR GOLD TRUST (GLD) as a tracker in our Stock Forecast Tool, the 10-day prediction window shows mixed signals. The gold proxy is trading at $214.61 at the time of publication. Vector signals show +0.40% for today. Prediction data is uploaded after the market close at 6 p.m., CST. Today’s data is based on market signals from the previous trading session.
The yield on the 10-year Treasury note is up at 4.286% at the time of publication.
The yield on the 30-year Treasury note is up at 4.407% at the time of publication.
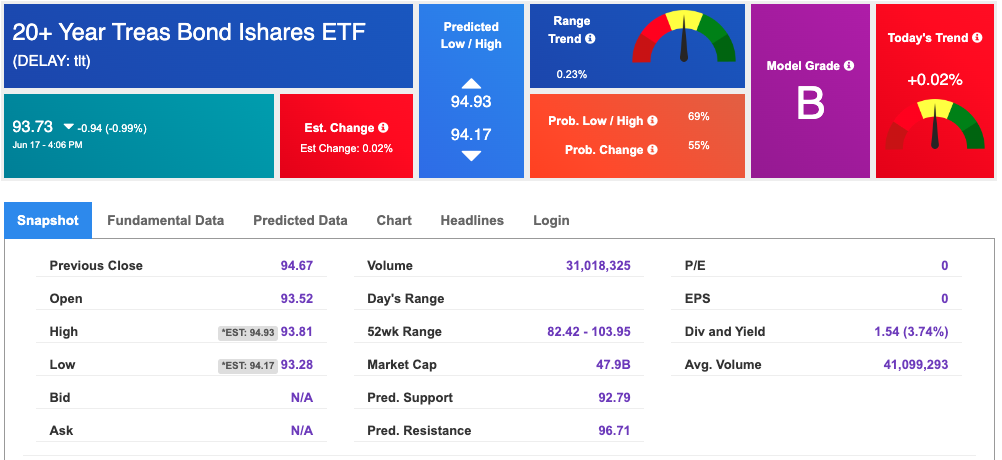
Using the iShares 20+ Year Treasury Bond ETF (TLT) as a proxy for bond prices in our Stock Forecast Tool, we see mixed signals in our 10-day prediction window. Prediction data is uploaded after the market close at 6 p.m., CST. Today’s data is based on market signals from the previous trading session.
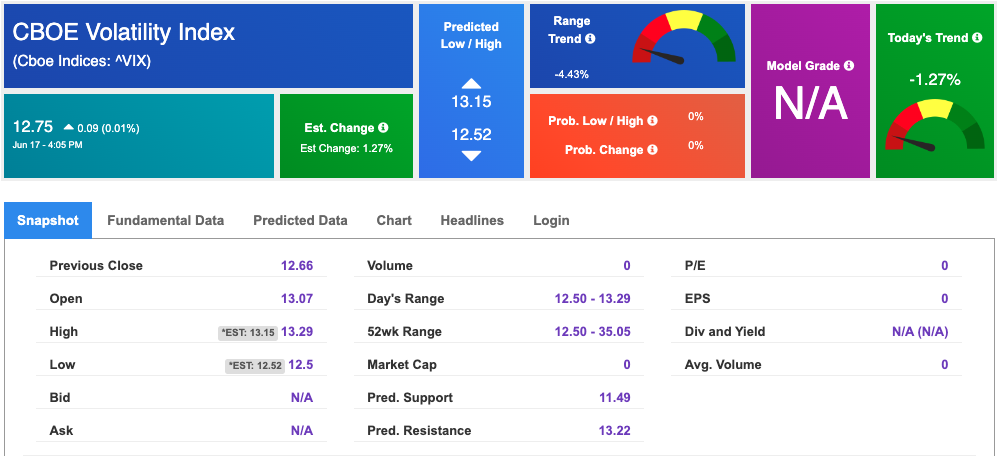
The CBOE Volatility Index (^VIX) is priced at $12.75 up 0.01% at the time of publication, and our 10-day prediction window shows mixed signals. Prediction data is uploaded after the market close at 6 p.m., CST. Today’s data is based on market signals from the previous trading session.
Please share this Tradespoon Market Commentary with your friends.
![]()

![]()
Comments Off on


Tradespoon Tools make finding winning trades in minute as easy as 1-2-3.
Our simple 3 step approach has resulted in an average return of almost 20% per trade!

