On Wednesday, after the Fed’s interest rate decision was announced, U.S. indices soared to their highest level in months. The Fed raised interest rates by 25 basis points, and investors responded positively as they anticipated the potential for further rate cuts in response to the current economic climate. This sparked a glorious rally in stocks across the board. With earnings season still in progress, several major names have recently released data, while a few key corporate reports are still due – more on that in a bit.
As expected, the Federal Reserve raised its federal funds’ rate by a quarter point and indicated that more increases may be necessary to regulate inflation, which presently stands at 6%, far exceeding their 2% target. The central bank’s statement explicitly laid out the current economic conditions and the potential for further action. The Federal Reserve has once again underlined the fact that rising rates take a while to actually affect the economy, so it is possible that further decreases in inflation may be seen.
This could mean that more than one rate hike from this point forward might not even be required. The Fed explicitly declared that they will analyze the upcoming economic data to determine how much further intervention is necessary. The two-year Treasury yield, which typically reflects anticipated fluctuations in the Fed funds rate, declined to a level of just under 4.10%.
In other economic reporting news, January’s ISM manufacturing index dropped to 47.4 from December’s 48.4, defying economists’ predictions of a slight rise to 48.1 and demonstrating a weakening of demand in the sector. Considering interest rates, an even more warranted pause in Fed rate-hiking is necessary as demand weakens. Look out for Apple earnings on Thursday, along with Google, Ford, and Starbucks.
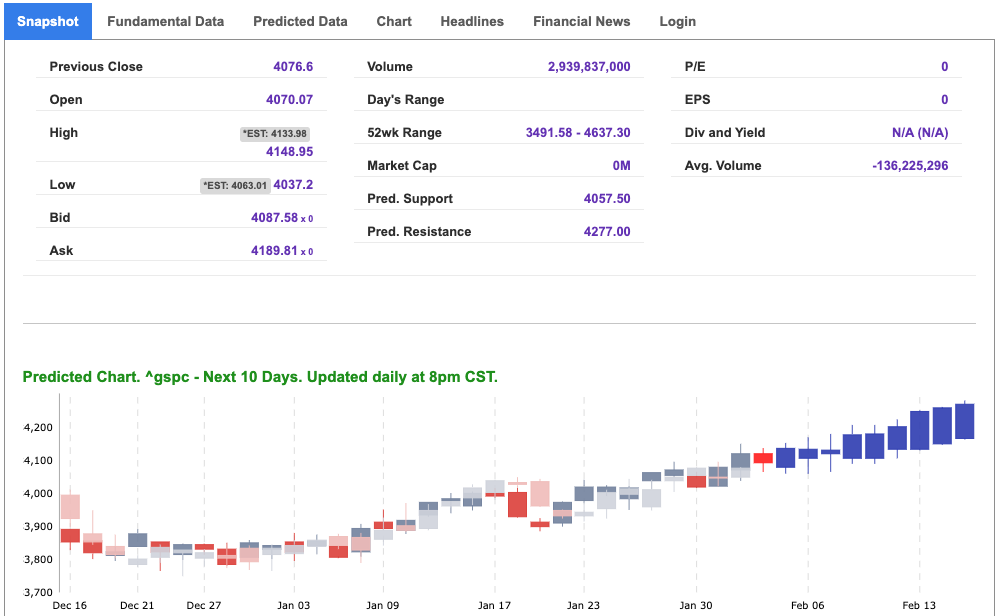
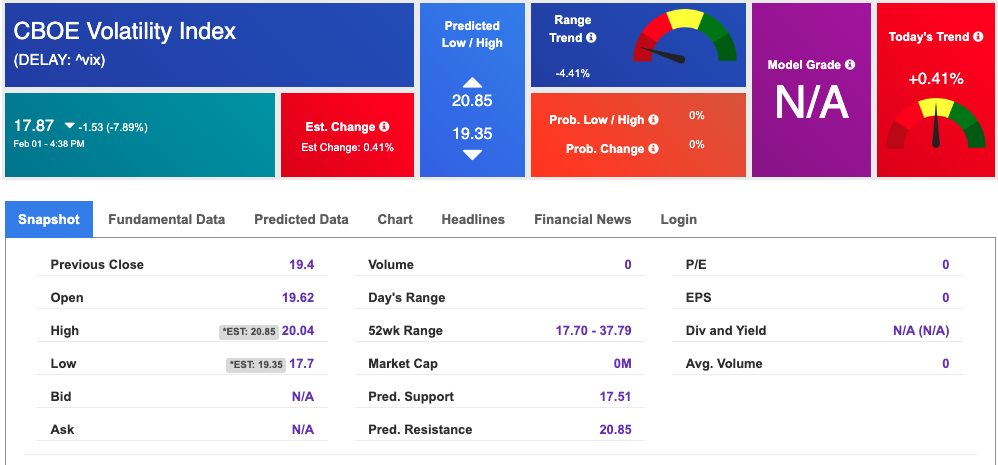
The VIX saw a massive dip today, currently trading near the $17 level. The CSX, BA, and TSLA earnings this week, as well as GDP data, can influence the next move in the market. We are watching the overhead resistance levels in the SPY, which are presently at $410 and then $416. The SPY support is at $402 and then $394. We expect the market to trade sideways for the next two to eight weeks. We would be market neutral on the market at this time and encourage subscribers to hedge their positions.
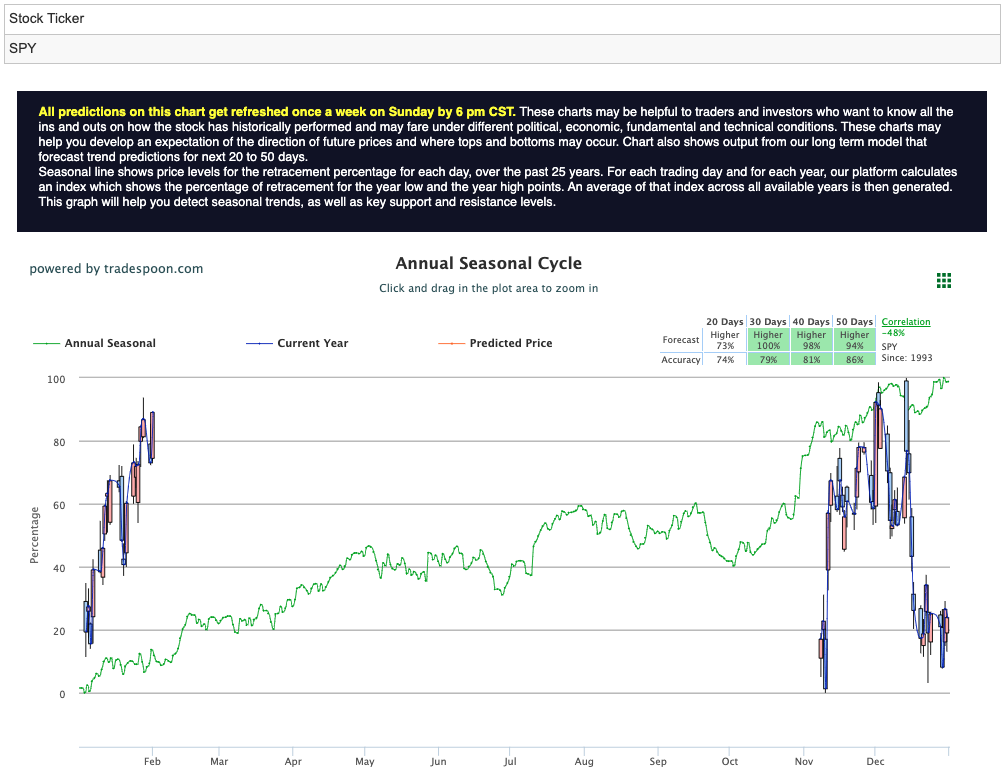
Market commentary readers should maintain clearly defined stop levels for all positions. For reference, the SPY Seasonal Chart is shown below:


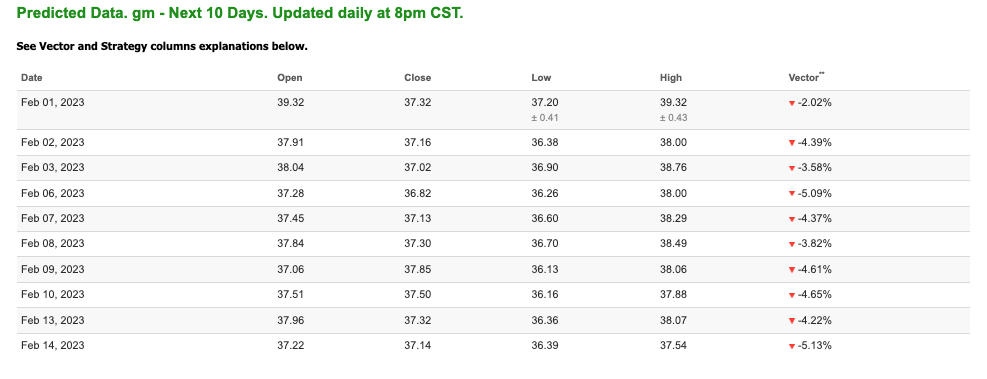
Note: The Vector column calculates the change of the Forecasted Average Price for the next trading session relative to the average of actual prices for the last trading session. The column shows the expected average price movement “Up or Down”, in percent. Trend traders should trade along the predicted direction of the Vector. The higher the value of the Vector the higher its momentum.
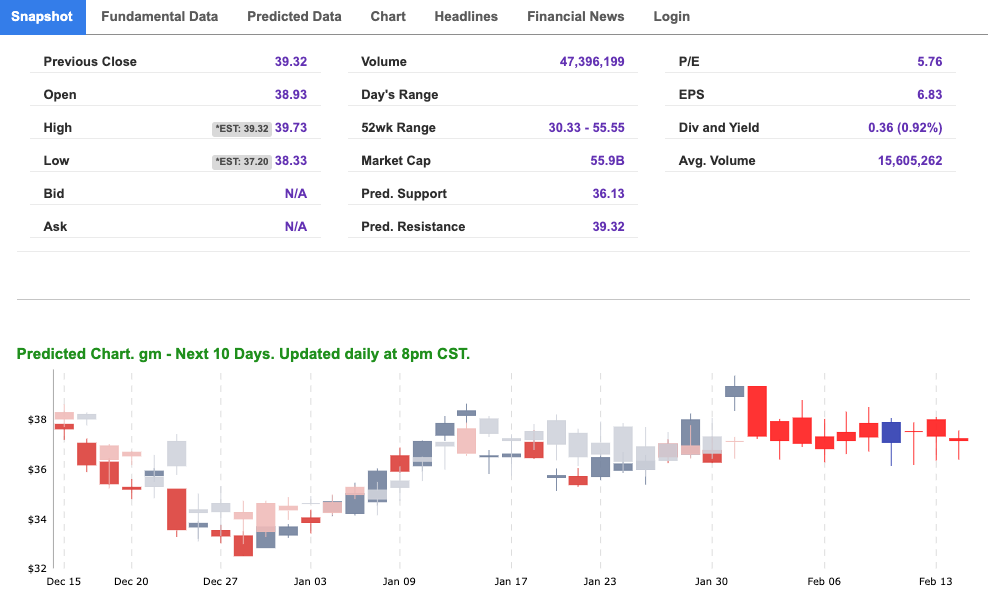
*Please note: At the time of publication Vlad Karpel does have a position in the featured symbol, gm. Our featured symbol is part of your free subscription service. It is not included in any paid Tradespoon subscription service. Vlad Karpel only trades his money in paid subscription services. If you are a paid subscriber, please review your Premium Member Picks, ActiveTrader, or MonthlyTrader recommendations. If you are interested in receiving Vlad’s picks, please click here.
West Texas Intermediate for Crude Oil delivery (CL.1) is priced at $76.70 per barrel, down 2.75%, at the time of publication.
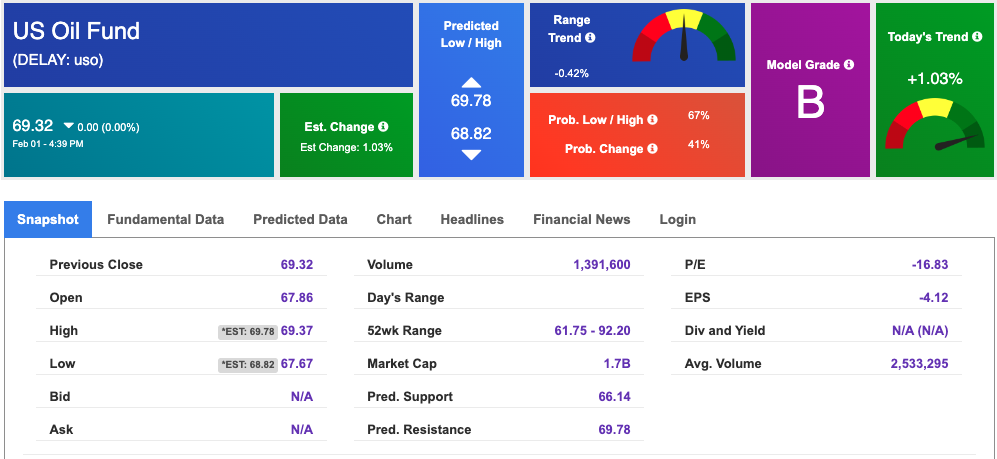
Looking at USO, a crude oil tracker, our 10-day prediction model shows mixed signals. The fund is trading at $69.32 at the time of publication. Prediction data is uploaded after the market close at 6 p.m., CST. Today’s data is based on market signals from the previous trading session.
The price for the Gold Continuous Contract (GC00) is up 1.11% at $1966.80 at the time of publication.
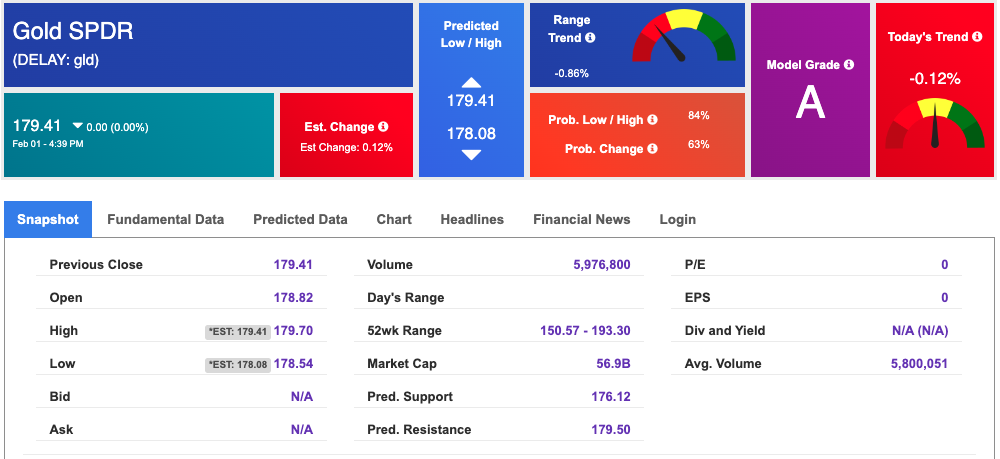
Using SPDR GOLD TRUST (GLD) as a tracker in our Stock Forecast Tool, the 10-day prediction window shows mixed signals. The gold proxy is trading at $179.41 at the time of publication. Vector signals show -0.12% for today. Prediction data is uploaded after the market close at 6 p.m., CST. Today’s data is based on market signals from the previous trading session.
The yield on the 10-year Treasury note is down at 3.424% at the time of publication.
The yield on the 30-year Treasury note is down at 3.569% at the time of publication.
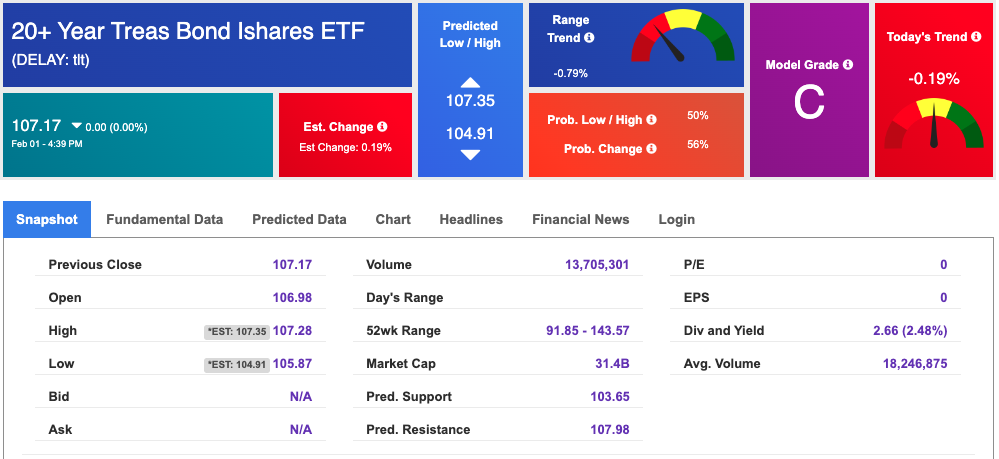
Using the iShares 20+ Year Treasury Bond ETF (TLT) as a proxy for bond prices in our Stock Forecast Tool, we see mixed signals in our 10-day prediction window. Prediction data is uploaded after the market close at 6 p.m., CST. Today’s data is based on market signals from the previous trading session.
The CBOE Volatility Index (^VIX) is $17.87 at the time of publication, and our 10-day prediction window shows mixed signals. Prediction data is uploaded after the market close at 6 p.m., CST. Today’s data is based on market signals from the previous trading session.
Comments Off on
Tradespoon Tools make finding winning trades in minute as easy as 1-2-3.
Our simple 3 step approach has resulted in an average return of almost 20% per trade!