 Special Offer: Try the 'WeeklyTrader Membership' for ONLY $37!
CLICK HERE TO LEARN MORE
Special Offer: Try the 'WeeklyTrader Membership' for ONLY $37!
CLICK HERE TO LEARN MORE
The stock market today saw a modest rebound as reports surfaced of potential tariff relief on technology products, fueling a glimmer of hope for market participants. This development came as a welcome reprieve, especially after the dollar had been near lows before beginning to show signs of recovery. However, despite this positive news, the broader tech and communication sectors continued to weigh on overall market performance. While more than 400 stocks in the S&P 500 saw gains, high-profile tech companies such as Nvidia, Microsoft, Tesla, Meta Platforms, and Amazon.com all experienced declines. Notably, Apple and Alphabet stood out as exceptions, with Apple seeing a modest rise of 2.4%, while Alphabet increased by 0.5%.
Despite the early optimism, sector-wide pullbacks persisted, with consumer discretionary stocks proving the most significant drag, down 1%. Energy and tech sectors also faced slight declines, contributing to the broader weakness in the market. While the tech-heavy stocks of the “Mag 7” were mostly under pressure, Apple and Alphabet showed resilience, although their gains were notably capped. In particular, Tesla and Amazon saw notable pullbacks, each down by 1.5%.
This volatility in the tech sector came in response to the latest comments from the Trump administration. Initially, a tech-relief rally began after discussions surfaced that smartphones, PCs, and other tech items would be spared from the sharp tariffs imposed on China. However, White House officials soon clarified that industry-specific tariffs would still be imposed on certain products, dampening the initial optimism.
Inflationary Pressures Persist Despite Modest Gains
Inflation remains a central theme for investors as concerns over rising prices continue to loom. In March, consumer inflation expectations for the next 12 months rose to 3.6%, up from February’s 3.1%, while three-year expectations remained at 3%, signaling a persistent inflationary environment. The Federal Reserve’s 2% inflation target remains in sight, though there are growing fears that inflation expectations could drift further from this goal, potentially pushing the Fed to remain hawkish, especially with tariffs continuing to weigh on the economy. However, inflation concerns were somewhat alleviated as expectations for the five-year period slightly decreased to 2.9% from 3%.
The March Consumer Price Index (CPI) report showed a year-over-year increase of 2.4%, slightly below expectations of 2.6%. The core CPI, which excludes volatile food and energy prices, rose by 2.8%, also below expectations of 3%, signaling that inflationary pressures remain significant but may be easing in certain areas. Housing and services have been major contributors to the ongoing inflation.
Last week’s Producer Price Index (PPI) also showed a surprising 0.4% drop, primarily driven by a 0.9% decline in goods prices such as gasoline, food, and energy. Although this PPI drop could be seen as positive, it also points to potential weakness in demand, a sign of slowing economic growth or even deflationary pressures on the horizon. The interplay between the CPI and PPI data creates a sense of uncertainty in the markets, as investors try to gauge whether inflation is moderating or if it could resurge.
In the oil markets, crude prices saw a notable uptick, rising by over 1% despite OPEC revising down its global oil-demand forecast. Both Brent and WTI crude prices climbed, with Brent hitting $65.67 a barrel and WTI at $62.38. This price movement was largely driven by President Trump’s decision to exclude several tech products from reciprocal tariffs, along with China’s reported rebound in crude oil imports. However, concerns linger over the global oil demand outlook, especially with OPEC cutting its oil-demand forecast for the year from 1.45 million barrels a day to 1.3 million barrels a day, citing the impact of U.S. tariffs.
This week’s key economic reports will continue to shape market sentiment. The Import Price Index, Retail Sales, Industrial Production, and Housing Permits are all scheduled for release, providing insight into the strength of consumer demand, manufacturing, and the housing market. These reports will be closely scrutinized as indicators of the broader economic health, especially as the ongoing tariff dispute with China continues to rattle investor confidence.
Outlook: A Cautious Market
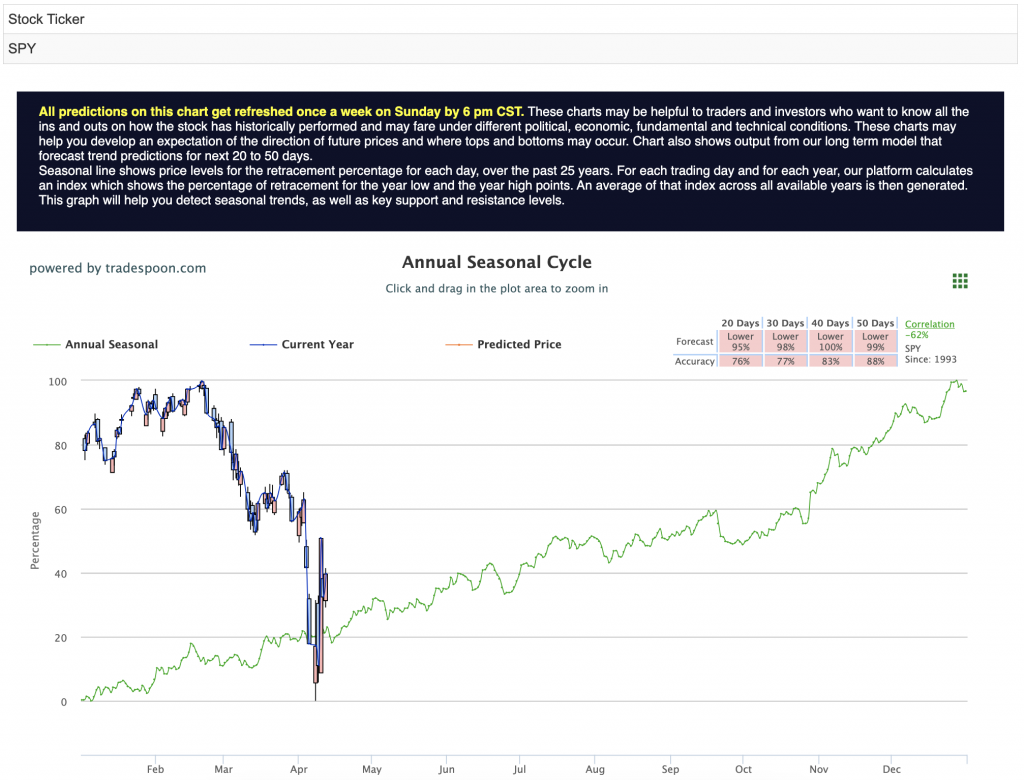
Amid this uncertain economic landscape, recession fears continue to build. With the Federal Reserve expected to keep interest rates elevated for a prolonged period, the market faces substantial headwinds. The S&P 500 is testing critical support levels between $500 and $530, while resistance is found in the $500 to $580 range. Short-term downside risk remains a concern, as the broader market sentiment remains cautious. For reference, the SPY Seasonal Chart is shown below:
With all these factors in play—rising recession risks, persistent inflationary pressures, and the ongoing tariff dispute—the market is likely to remain volatile in the short term. Despite occasional rallies, the overall trend points toward downside pressure in the near term. As the trade war with China continues to dominate the headlines, market sentiment will remain highly influenced by any developments in global trade negotiations.
For investors, this means the need to stay informed and cautious, adjusting strategies based on evolving macroeconomic conditions. With recession fears building and inflationary pressures still in the mix, staying agile in this uncertain environment will be crucial for navigating the road ahead. A neutral stance remains advisable for those looking to manage risk effectively amid ongoing market turbulence.
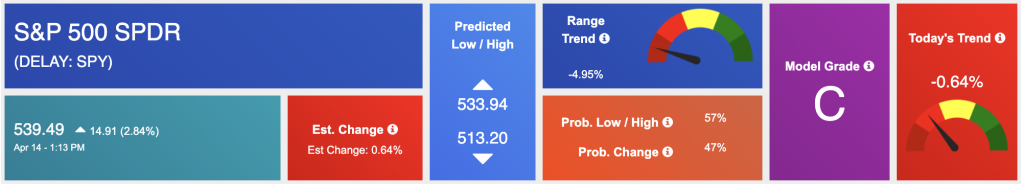
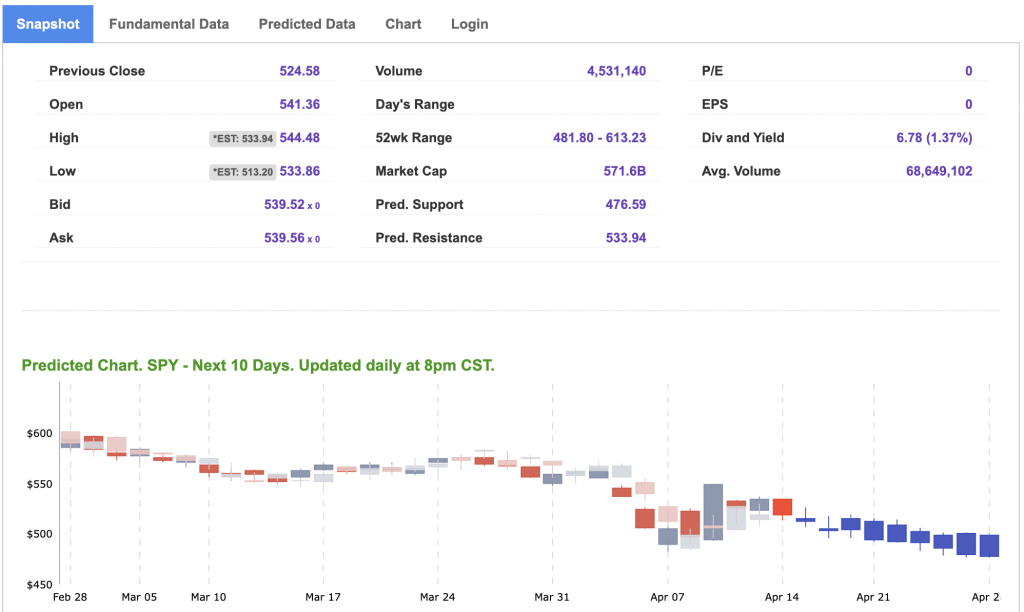
Using the “SPY” symbol to analyze the S&P 500 our 10-day prediction window shows a near-term positive outlook. Prediction data is uploaded after the market closes at 6 p.m. CST. Today’s data is based on market signals from the previous trading session.
Our featured symbol for Tuesday is AAPL. Apple Inc. – AAPL is showing a steady vector in our Stock Forecast Toolbox’s 10-day forecast.
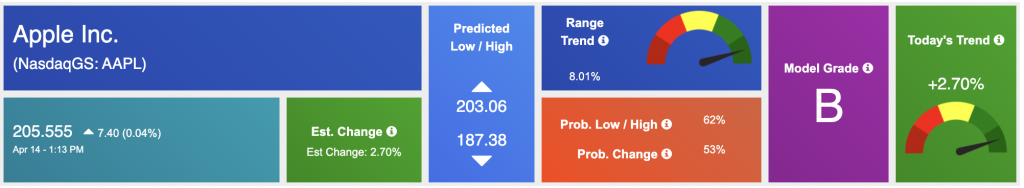
The symbol is trading at $205.55 with a vector of +2.71% at the time of publication.
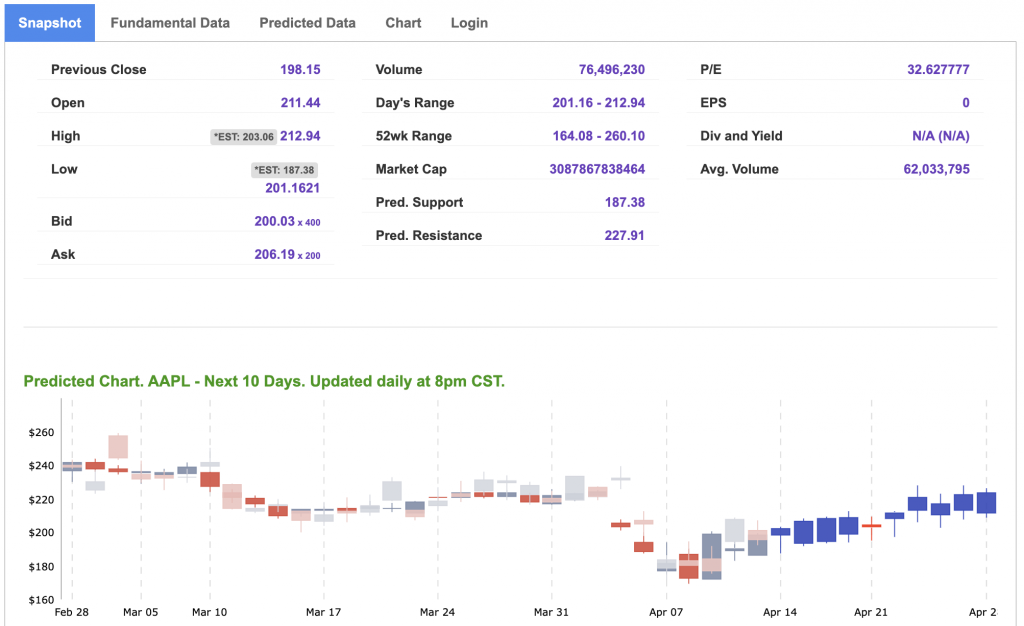
10-Day Prediction data is uploaded after the market close at 6 p.m., CST. Today’s data is based on market signals from the previous trading session.
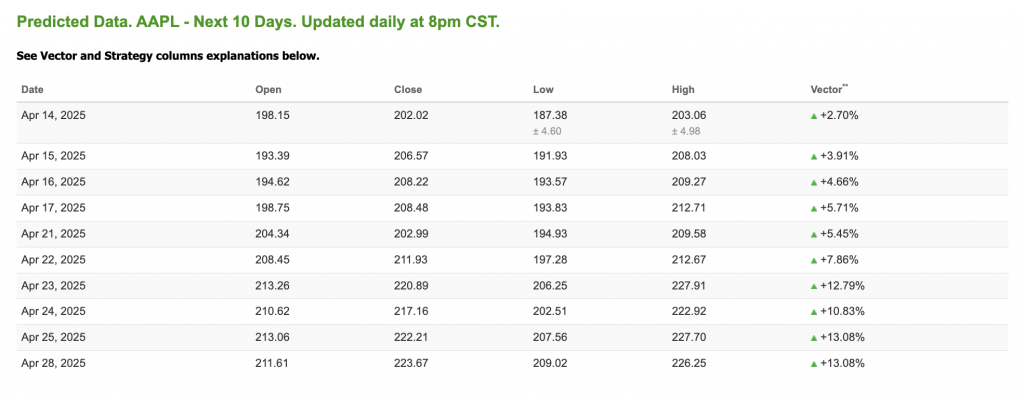
Note: The Vector column calculates the change of the Forecasted Average Price for the next trading session relative to the average of actual prices for the last trading session. The column shows the expected average price movement “Up or Down”, in percent. Trend traders should trade along the predicted direction of the Vector. The higher the value of the Vector the higher its momentum.
*Please note: At the time of publication Vlad Karpel does have a position in the featured symbol, AAPL. Our featured symbol is part of your free subscription service. It is not included in any paid Tradespoon subscription service. Vlad Karpel only trades his money in paid subscription services. If you are a paid subscriber, please review your Premium Member Picks, ActiveTrader, or MonthlyTrader recommendations. If you are interested in receiving Vlad’s picks, please click here.
West Texas Intermediate for Crude Oil delivery (CL.1) is priced at $61.48 per barrel, down 0.08%, at the time of publication.
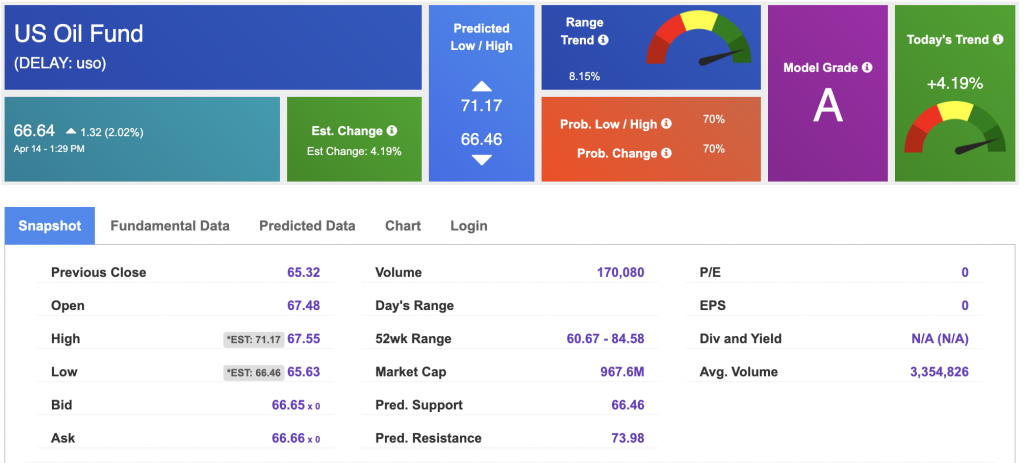
Looking at USO, a crude oil tracker, our 10-day prediction model shows mixed signals. The fund is trading at $66.64 at the time of publication. Prediction data is uploaded after the market close at 6 p.m., CST. Today’s data is based on market signals from the previous trading session.
The price for the Gold Continuous Contract (GC00) is down 0.83% at $3,217.70 at the time of publication.
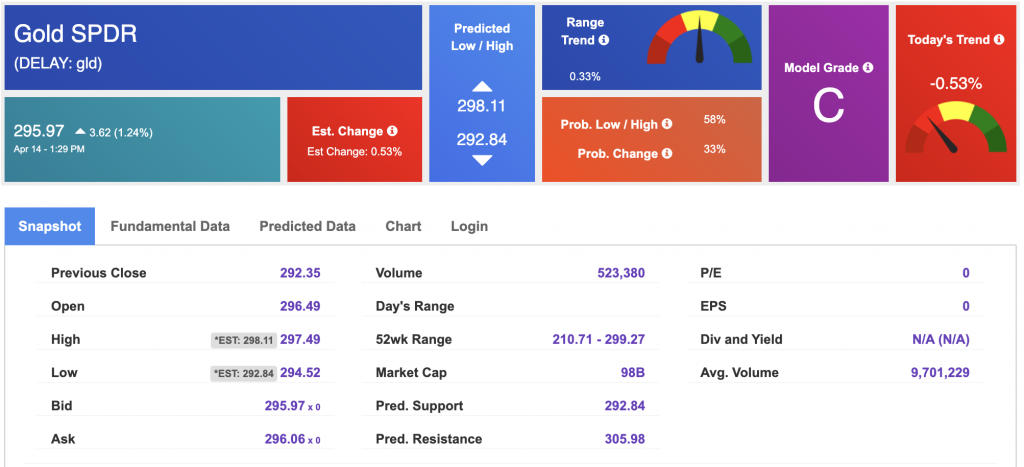
Using SPDR GOLD TRUST (GLD) as a tracker in our Stock Forecast Tool, the 10-day prediction window shows mixed signals. The gold proxy is trading at $295.97 at the time of publication. Vector signals show -0.53% for today. Prediction data is uploaded after the market close at 6 p.m., CST. Today’s data is based on market signals from the previous trading session.
The yield on the 10-year Treasury note is down at 4.372% at the time of publication.
The yield on the 30-year Treasury note is down at 4.804% at the time of publication.
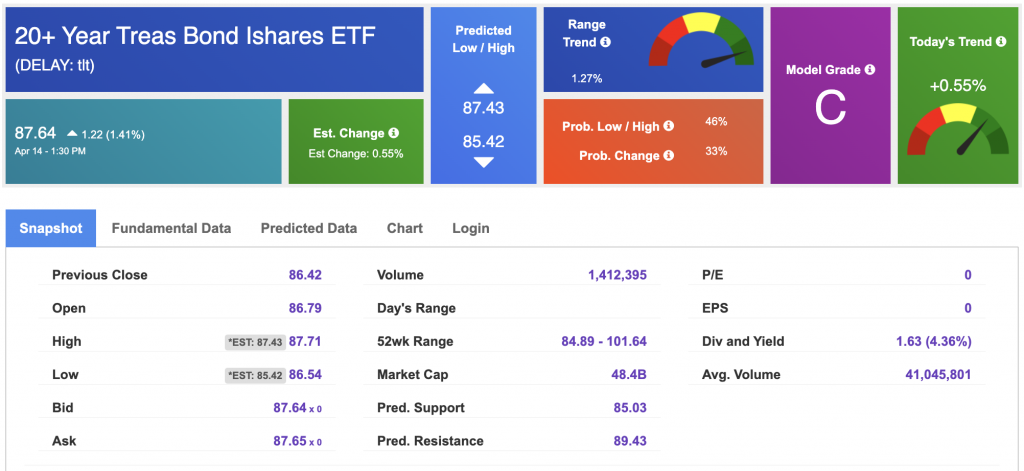
Using the iShares 20+ Year Treasury Bond ETF (TLT) as a proxy for bond prices in our Stock Forecast Tool, we see mixed signals in our 10-day prediction window. Prediction data is uploaded after the market close at 6 p.m., CST. Today’s data is based on market signals from the previous trading session.
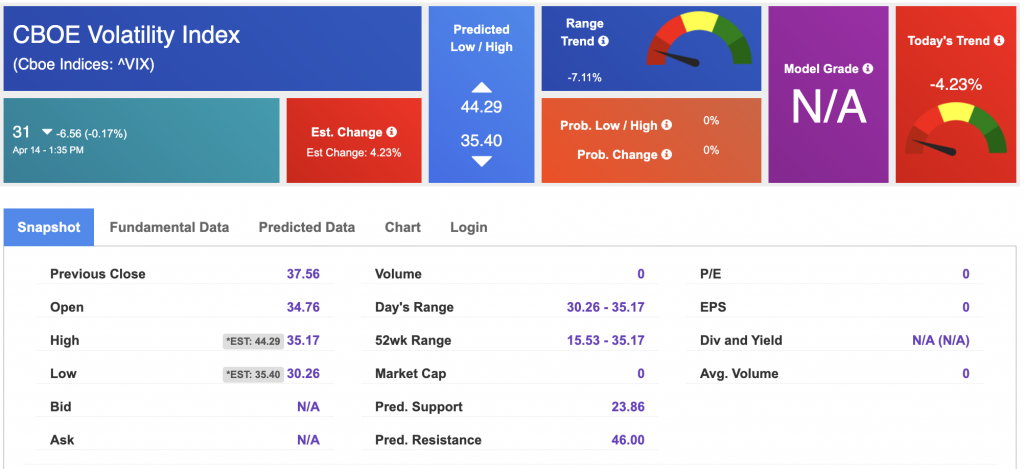
The CBOE Volatility Index (^VIX) is priced at $31 at the time of publication, and our 10-day prediction window shows mixed signals. Prediction data is uploaded after the market close at 6 p.m., CST. Today’s data is based on market signals from the previous trading session.
Please share this Tradespoon Market Commentary with your friends.
![]()

![]()
Comments Off on


Tradespoon Tools make finding winning trades in minute as easy as 1-2-3.
Our simple 3 step approach has resulted in an average return of almost 20% per trade!

