 Special Offer: Try the 'WeeklyTrader Membership' for ONLY $37!
CLICK HERE TO LEARN MORE
Special Offer: Try the 'WeeklyTrader Membership' for ONLY $37!
CLICK HERE TO LEARN MORE
On Monday, the stock market roared back to life, fueled by a dramatic rebound in the Magnificent Seven and chip stocks, which had faced a rough patch the previous week. Meanwhile, the Dow Jones Industrial Average trailed, showcasing uneven performance across sectors. This surge came on the heels of President Joe Biden’s unexpected announcement that he would not seek reelection and his endorsement of Vice President Kamala Harris as the Democratic frontrunner. As investors digest this major political shift, they are gearing up for a whirlwind week packed with pivotal earnings reports, a sneak peek at second-quarter GDP, and the Federal Reserve’s latest inflation metrics for June.
Investors are focusing on a slew of high-profile companies scheduled to report their earnings later this week. Notable among them are Tesla, Alphabet, Visa, Coca-Cola, Texas Instruments, GE Aerospace, Comcast, Philip Morris, United Parcel Service, Lockheed Martin, Spotify Technology, General Motors, Thermo Fisher Scientific, IBM, AT&T, ServiceNow, Chipotle Mexican Grill, AbbVie, Union Pacific, Honeywell International, RTX, Royal Caribbean, Bristol Myers Squibb, Colgate-Palmolive, and 3M. These results will be pivotal in shaping market sentiment as we navigate the second quarter’s economic landscape.
Gold prices experienced a dip below the $2,400 per troy ounce level, pressured by profit-taking and a rebound in the U.S. dollar index. Futures fell by 0.4% to $2,389.00 per troy ounce after an initial rise earlier in the session, driven by safe-haven demand following Biden’s presidential race withdrawal. Similarly, oil futures declined, extending Friday’s substantial losses. Concerns about weakening demand were heightened by the Chinese central bank’s decision to cut a key interest rate.
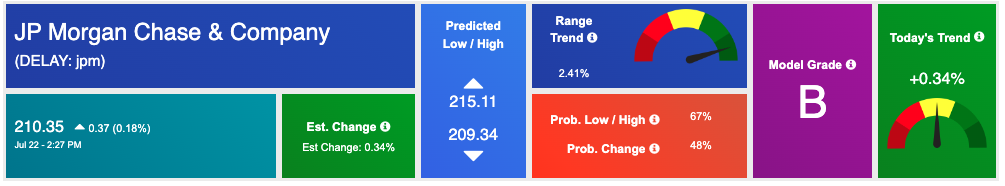
The second-quarter earnings season began with a mixed performance across various sectors. JPMorgan Chase & Co. delivered robust earnings and revenue, exceeding Wall Street expectations and showcasing its resilience amid volatile market conditions. This performance underscores JPMorgan’s adeptness at navigating market fluctuations. Wells Fargo also reported stronger-than-expected earnings, though its stock experienced a dip in premarket trading, reflecting investor apprehensions about its future prospects.
Retail sales data for June revealed an unexpectedly positive outlook. Sales remained stable, contrary to forecasts of a decline, signaling ongoing consumer spending strength. Excluding autos and gas, retail sales rose by 0.8%, surpassing the anticipated 0.2% increase. Additionally, the control group, influential in GDP calculations, saw a 0.9% rise, far exceeding predictions and indicating robust consumer activity beyond the automotive and gas sectors.
The Federal Reserve’s Beige Book, released midweek, painted a picture of economic softening across its twelve districts. Five regions reported flat or declining activity, reflecting a cooling labor market and slower economic growth. Uncertainties related to upcoming elections and geopolitical tensions have contributed to a cautious economic outlook, intensifying market volatility as investors recalibrate expectations for interest rate adjustments.
Economic indicators presented a mixed picture this week. Initial jobless claims rose by 20,000, and the Consumer Price Index (CPI) for June increased by 3.0% year-over-year. The Conference Board’s Leading Economic Index (LEI) fell by 0.2% to 101.1 in June, marking its fourth consecutive monthly decline, suggesting ongoing economic uncertainty. The 10-year Treasury yield exhibited volatility, fluctuating between 4.2% and 4.7%, and testing the 4.3% level this week amid discussions about potential interest rate cuts.
Interest-sensitive stocks have shown resilience, with small-cap stocks ($IWM) nearing their 2021 highs and banks ($XLF) benefiting from the lower CPI print last week. Meanwhile, value stocks and other interest-sensitive equities are trending upward, while the QQQ and SPY are consolidating. The VIX, a measure of market volatility, remains low around 12, indicating subdued investor fear. However, equity expirations this week have added complexity to the trading environment, contributing to the market’s recent sell-off.
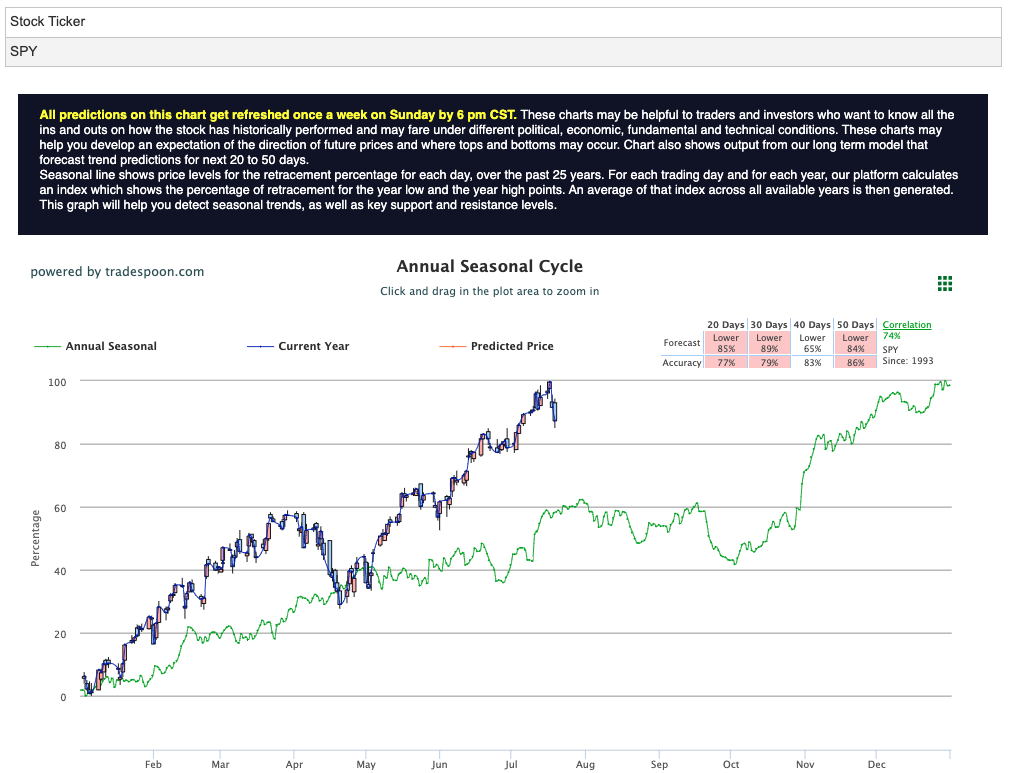
Despite the market’s recent challenges, I remain bullish. Inflation is aligning with expectations, and earnings season has thus far surpassed forecasts. However, risks persist, including a cooling economy, rising unemployment, and potential failures of small banks with exposure to commercial and residential real estate. The SPY rally has encountered resistance at the $560–575 levels, with short-term support around $520–530. Moving forward, I anticipate the market will continue to post higher highs and higher lows, reflecting a cautious yet optimistic outlook amid evolving conditions. For reference, the SPY Seasonal Chart is shown below:
As we dive into the heart of summer, investors should prepare for possible volatility while maintaining a cautiously optimistic outlook, buoyed by strong economic indicators and impressive corporate performance to date.
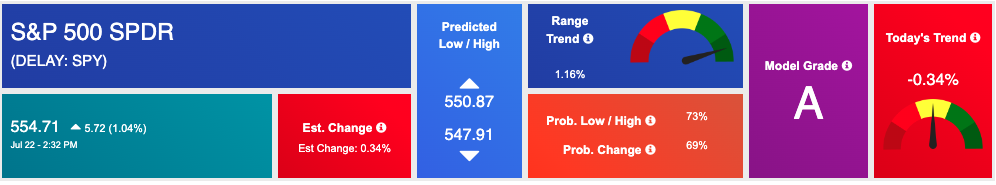
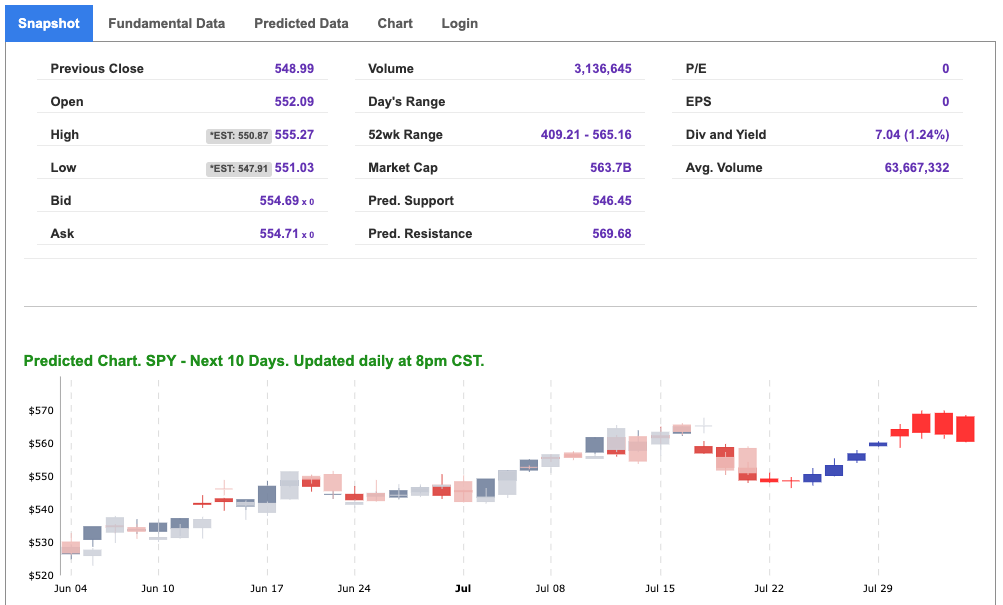
Using the “SPY” symbol to analyze the S&P 500 our 10-day prediction window shows a near-term positive outlook. Prediction data is uploaded after the market closes at 6 p.m. CST. Today’s data is based on market signals from the previous trading session.
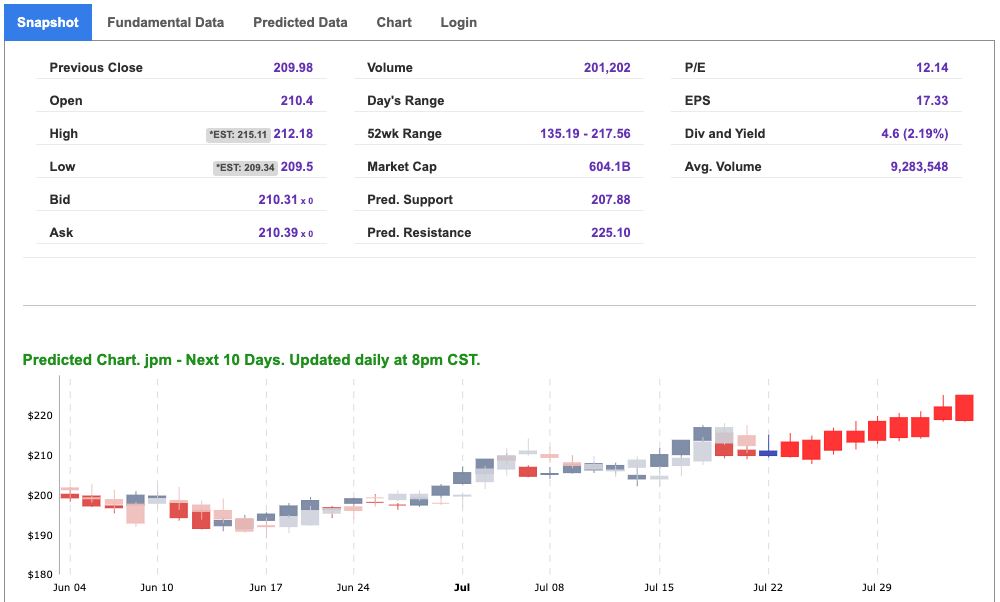
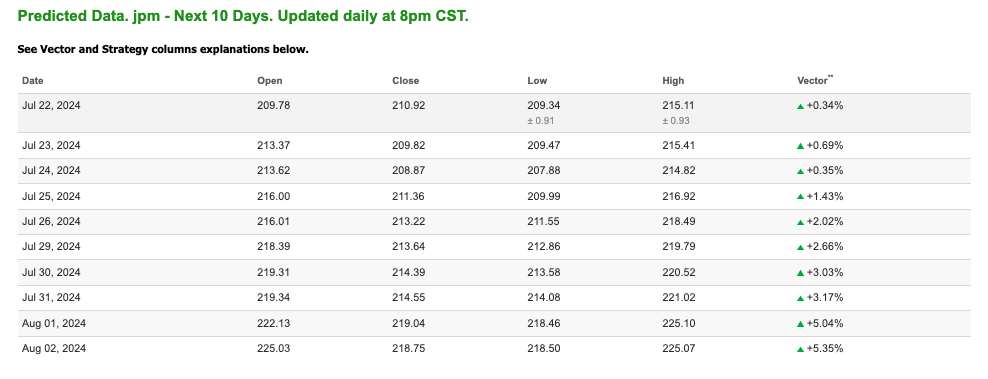
Note: The Vector column calculates the change of the Forecasted Average Price for the next trading session relative to the average of actual prices for the last trading session. The column shows the expected average price movement “Up or Down”, in percent. Trend traders should trade along the predicted direction of the Vector. The higher the value of the Vector the higher its momentum.
*Please note: At the time of publication Vlad Karpel does have a position in the featured symbol, jpm. Our featured symbol is part of your free subscription service. It is not included in any paid Tradespoon subscription service. Vlad Karpel only trades his money in paid subscription services. If you are a paid subscriber, please review your Premium Member Picks, ActiveTrader, or MonthlyTrader recommendations. If you are interested in receiving Vlad’s picks, please click here.
West Texas Intermediate for Crude Oil delivery (CL.1) is priced at $79.95 per barrel, down 0.22%, at the time of publication.
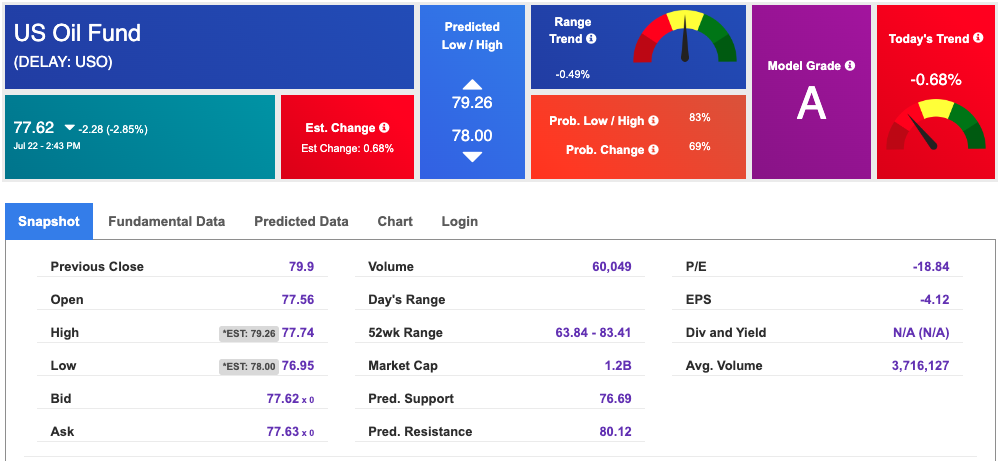
Looking at USO, a crude oil tracker, our 10-day prediction model shows mixed signals. The fund is trading at $77.62 at the time of publication. Prediction data is uploaded after the market close at 6 p.m., CST. Today’s data is based on market signals from the previous trading session.
The price for the Gold Continuous Contract (GC00) is up 0.03% at $2399.60 at the time of publication.
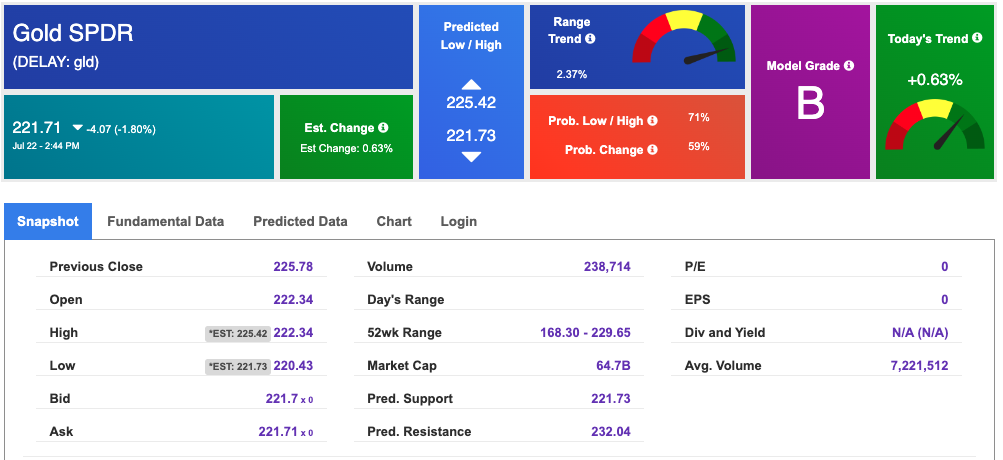
Using SPDR GOLD TRUST (GLD) as a tracker in our Stock Forecast Tool, the 10-day prediction window shows mixed signals. The gold proxy is trading at $221.71 at the time of publication. Vector signals show +0.63% for today. Prediction data is uploaded after the market close at 6 p.m., CST. Today’s data is based on market signals from the previous trading session.
The yield on the 10-year Treasury note is up at 4.258% at the time of publication.
The yield on the 30-year Treasury note is up at 4.476% at the time of publication.
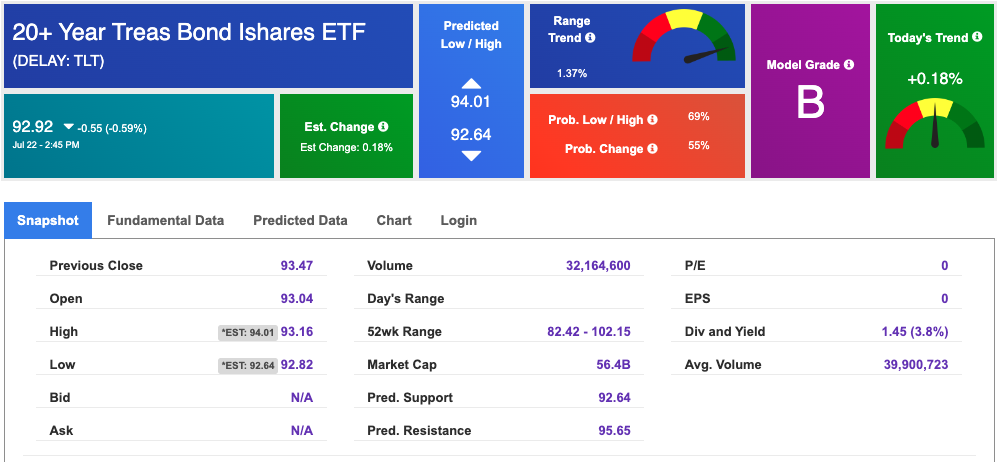
Using the iShares 20+ Year Treasury Bond ETF (TLT) as a proxy for bond prices in our Stock Forecast Tool, we see mixed signals in our 10-day prediction window. Prediction data is uploaded after the market close at 6 p.m., CST. Today’s data is based on market signals from the previous trading session.
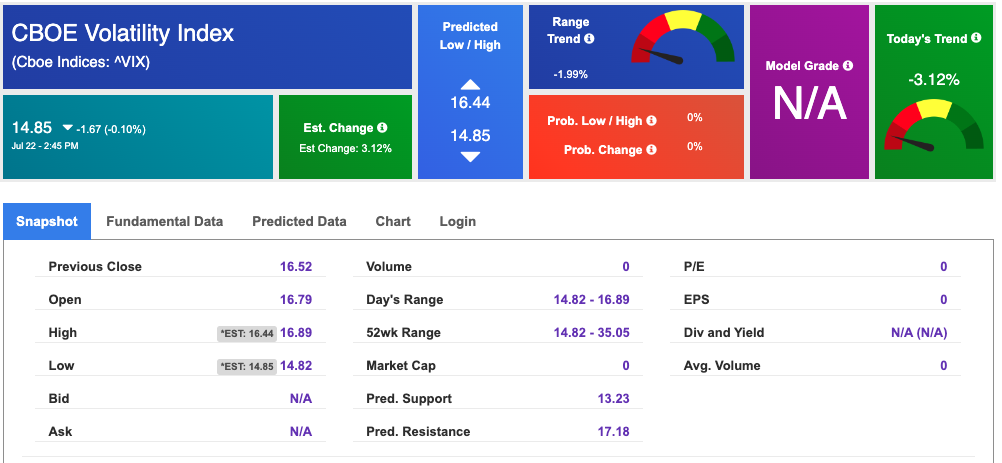
The CBOE Volatility Index (^VIX) is priced at $14.85 up 0.04% at the time of publication, and our 10-day prediction window shows mixed signals. Prediction data is uploaded after the market close at 6 p.m., CST. Today’s data is based on market signals from the previous trading session.
Please share this Tradespoon Market Commentary with your friends.
![]()

![]()
Comments Off on


Tradespoon Tools make finding winning trades in minute as easy as 1-2-3.
Our simple 3 step approach has resulted in an average return of almost 20% per trade!

