 Special Offer: Try the 'ShadowTrader Membership' for ONLY $37!
CLICK HERE TO LEARN MORE
Special Offer: Try the 'ShadowTrader Membership' for ONLY $37!
CLICK HERE TO LEARN MORE
On Monday, all three major U.S. stock indices traded slightly higher, supported by a quiet day on Wall Street. With U.S. bond markets closed for Columbus Day and no significant earnings or economic data scheduled, the stock market faced minimal pushback in continuing its recent rally. However, the calm may be brief as earnings season heats up in the coming weeks, testing the strength of the recent gains. Wall Street is also keeping a close eye on the 2024 U.S. elections and ongoing geopolitical tensions in the Middle East, both of which could add volatility in the coming months.
AI Stocks Lead Early Gains, Energy Sector Struggles
AI-linked stocks drove the early rally on Monday, but as the session wore on, most sectors joined in. The only major sector in the S&P 500 to lose ground was energy, which struggled as West Texas Intermediate (WTI) crude oil futures dipped, applying downward pressure. Meanwhile, the CBOE Volatility Index (VIX) fell 3% to 19.85. A VIX reading below 20 typically suggests more stable market conditions, a welcome shift after heightened volatility last week.
Inflation Data Sends Mixed Signals
Inflation remains a key concern for investors as it heavily influences the Federal Reserve’s future interest rate decisions. Last week, crucial inflation data came in slightly above expectations. The Consumer Price Index (CPI) for September rose by 2.4% year-over-year, just above the forecast of 2.3%. Core inflation, which excludes volatile food and energy prices, ticked up to 3.3% from 3.2% in August. This persistent inflation continues to put pressure on the Federal Reserve, raising the possibility that the central bank may maintain or even increase interest rates to curb rising prices.
Later in the week, the Producer Price Index (PPI) offered some relief, coming in flat for September compared to an expected rise of 0.1%. While this suggests that inflationary pressures may be easing in the production chain, it wasn’t enough to significantly alter the market’s concern over future Fed rate decisions. These inflation reports will feed into the Fed’s preferred measure, the Core Personal Consumption Expenditures (PCE) index, which continues to be a focal point in guiding monetary policy.
The bond market, particularly Treasury yields, remains a critical factor for the stock market. The 10-year yield has hovered between 3.6% and 4.4% following the CPI report, continuing to pressure equities, especially in rate-sensitive sectors like real estate and utilities. Higher yields often present competition for stocks, as investors seek safer, higher-return alternatives.
Earnings Season: A Mixed Start
The kickoff to earnings season last week provided a mixed bag of results. JPMorgan Chase ($JPM) led the financial sector, reporting strong third-quarter earnings of $1.42 per share, beating estimates and sending the stock up 5.1%. This performance lifted the Dow and bolstered optimism for the broader banking sector. However, results in other sectors were less impressive, leading to sell-offs that tempered market enthusiasm.
This week, a heavy lineup of earnings reports is expected, with major companies like UnitedHealth, Johnson & Johnson, Bank of America, Goldman Sachs, Citigroup, PNC Financial, ASML Holding, United Airlines, and Netflix set to release their quarterly figures. Other key names reporting include Abbott Laboratories, CSX, Las Vegas Sands, Taiwan Semiconductor Manufacturing, Intuitive Surgical, Blackstone, Procter & Gamble, American Express, and SLB.
On Monday, Bank of America remained flat, while Citigroup gained 0.4% ahead of their earnings reports, both scheduled for release before Tuesday’s market open. Last week, JPMorgan Chase and Wells Fargo posted third-quarter results that, while down from a year ago, still managed to beat analysts’ expectations. Despite this, JPMorgan fell 0.4%, while Wells Fargo saw a 2.5% gain on Friday.
Market Outlook: Caution Ahead
Despite earnings coming in better than expected and inflation data mostly within forecasts, I remain in the market neutral camp. The top appears to be set, with risks still looming. The economy is showing signs of cooling, unemployment is ticking up, and small banks are facing increasing pressure due to exposure to commercial and residential real estate. These indicators suggest that a soft landing may be more elusive than hoped, and we could be nearing a recession.
Moreover, elevated Treasury yields and a gradual normalization of the yield curve are adding to the pressure on stocks. The broadening participation in the market is a positive sign, but I believe the current market correction is not yet complete. Investors should exercise caution and avoid chasing rebounds with additional capital, as the risks remain elevated.
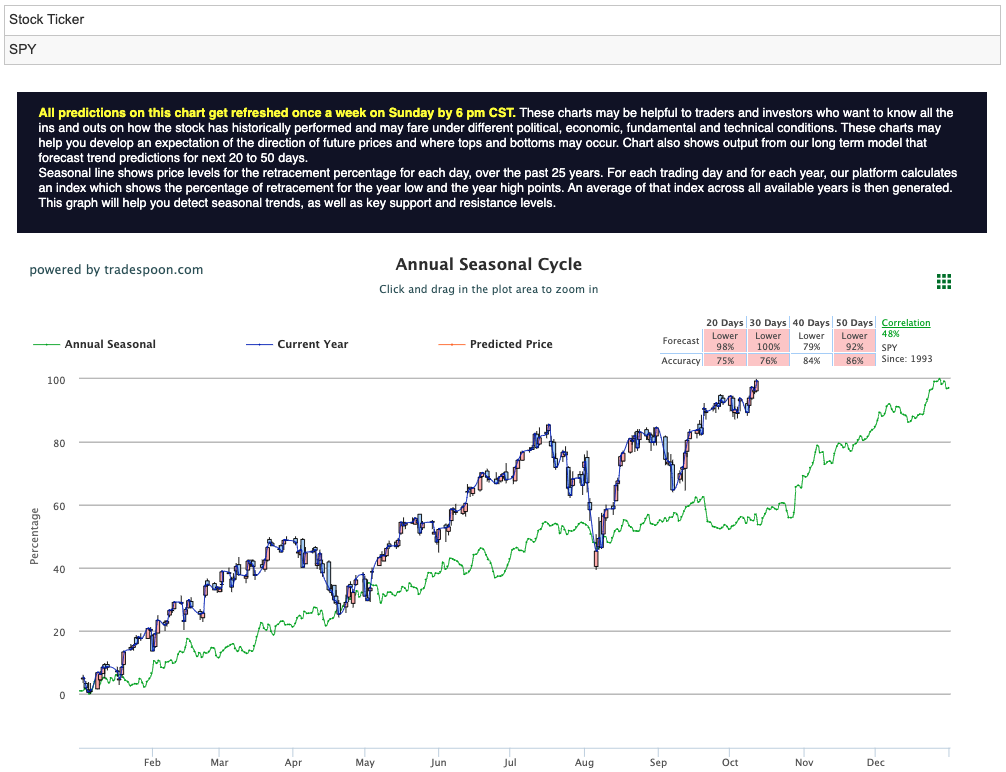
In the coming months, I expect the S&P 500 (SPY) rally to be capped around the $570–$580 range, with short-term support levels between $520 and $540. While the short- and medium-term outlooks suggest sideways trading, the long-term trend remains intact. However, given the complex mix of earnings, inflation data, and geopolitical factors, volatility is likely to persist, and the market will need more clarity before a sustained breakout can occur. For reference, the SPY Seasonal Chart is shown below:
In this environment, I recommend maintaining a balanced approach and being cautious about overcommitting capital during market rebounds. The upcoming earnings reports and economic data will provide crucial insights, but the path forward remains uncertain.
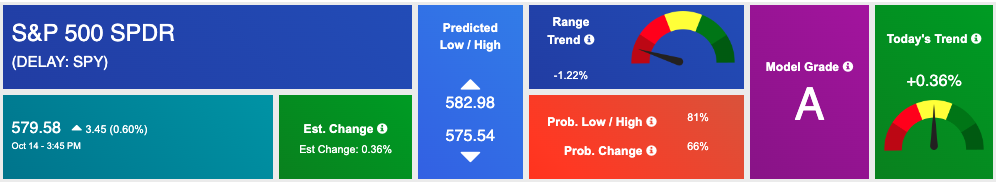
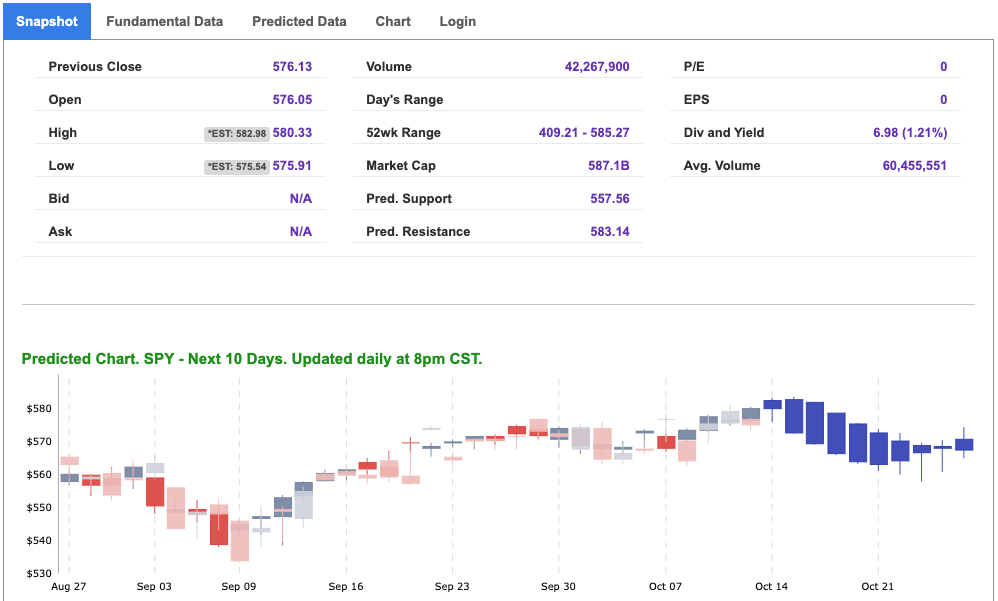
Using the “SPY” symbol to analyze the S&P 500 our 10-day prediction window shows a near-term positive outlook. Prediction data is uploaded after the market closes at 6 p.m. CST. Today’s data is based on market signals from the previous trading session.
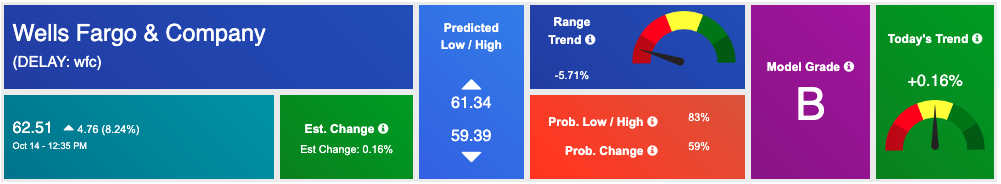
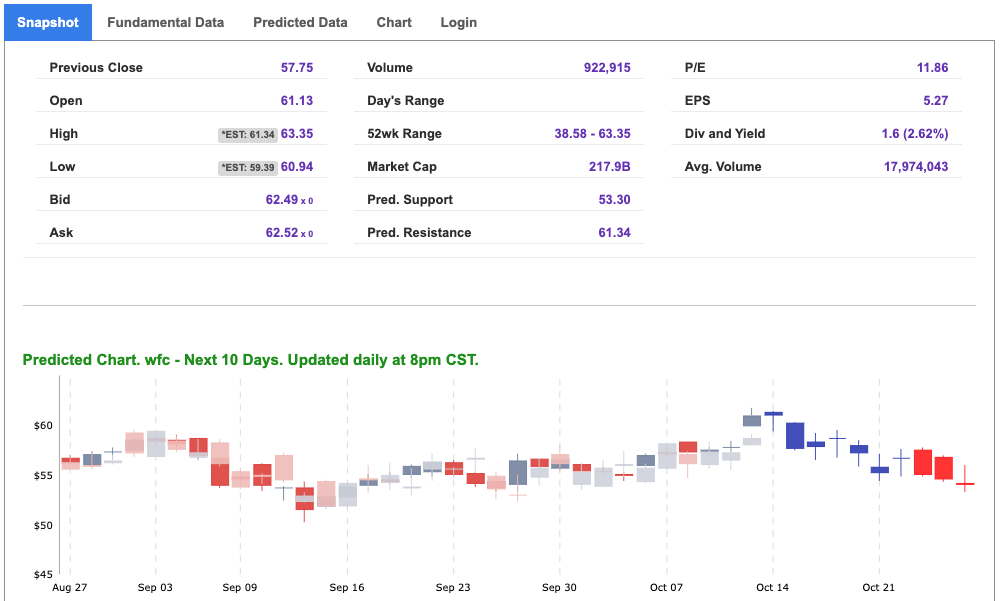
Our featured symbol for Tuesday is Wells Fargo & Co. – WFC is showing a steady vector in our Stock Forecast Toolbox’s 10-day forecast.
The symbol is trading at $62.51 with a vector of +0.16% at the time of publication.
10-Day Prediction data is uploaded after the market close at 6 p.m., CST. Today’s data is based on market signals from the previous trading session.
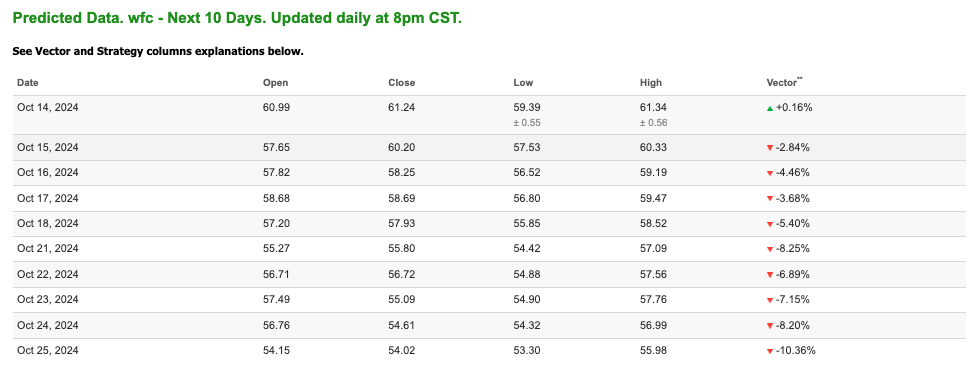
Note: The Vector column calculates the change of the Forecasted Average Price for the next trading session relative to the average of actual prices for the last trading session. The column shows the expected average price movement “Up or Down”, in percent. Trend traders should trade along the predicted direction of the Vector. The higher the value of the Vector the higher its momentum.
*Please note: At the time of publication Vlad Karpel does have a position in the featured symbol, wfc. Our featured symbol is part of your free subscription service. It is not included in any paid Tradespoon subscription service. Vlad Karpel only trades his money in paid subscription services. If you are a paid subscriber, please review your Premium Member Picks, ActiveTrader, or MonthlyTrader recommendations. If you are interested in receiving Vlad’s picks, please click here.
West Texas Intermediate for Crude Oil delivery (CL.1) is priced at $71.87 per barrel, down 4.88%, at the time of publication.
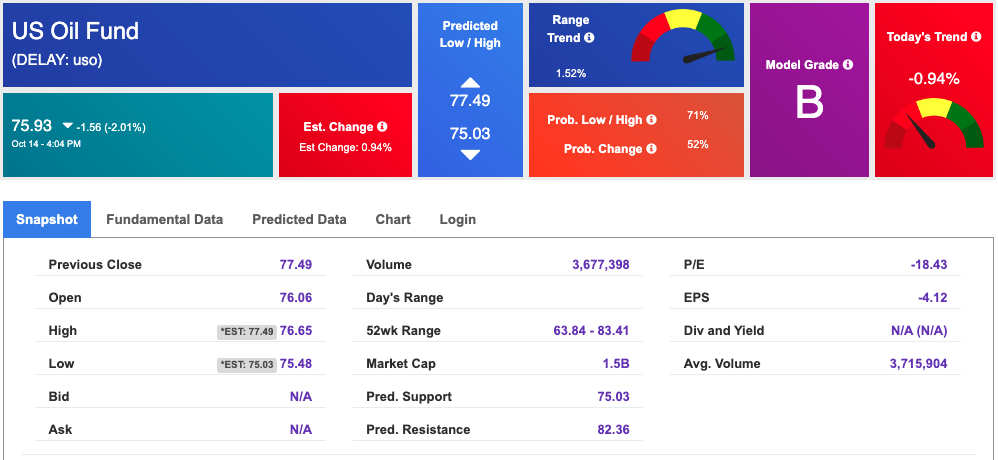
Looking at USO, a crude oil tracker, our 10-day prediction model shows mixed signals. The fund is trading at $75.93 at the time of publication. Prediction data is uploaded after the market close at 6 p.m., CST. Today’s data is based on market signals from the previous trading session.
The price for the Gold Continuous Contract (GC00) is down 0.39% at $2,665.80 at the time of publication.
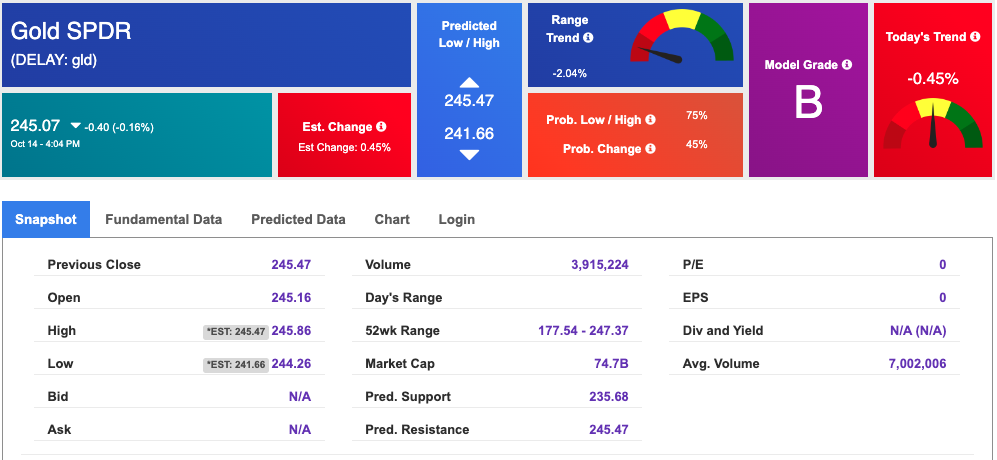
Using SPDR GOLD TRUST (GLD) as a tracker in our Stock Forecast Tool, the 10-day prediction window shows mixed signals. The gold proxy is trading at $245.07 at the time of publication. Vector signals show -0.45% for today. Prediction data is uploaded after the market close at 6 p.m., CST. Today’s data is based on market signals from the previous trading session.
The yield on the 10-year Treasury note is flat at 4.105% at the time of publication.
The yield on the 30-year Treasury note is flat at 4.414% at the time of publication.
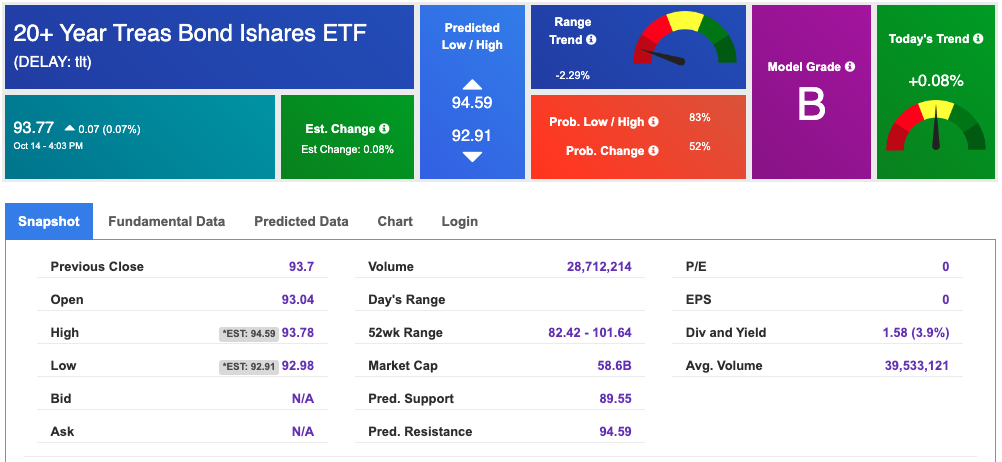
Using the iShares 20+ Year Treasury Bond ETF (TLT) as a proxy for bond prices in our Stock Forecast Tool, we see mixed signals in our 10-day prediction window. Prediction data is uploaded after the market close at 6 p.m., CST. Today’s data is based on market signals from the previous trading session.
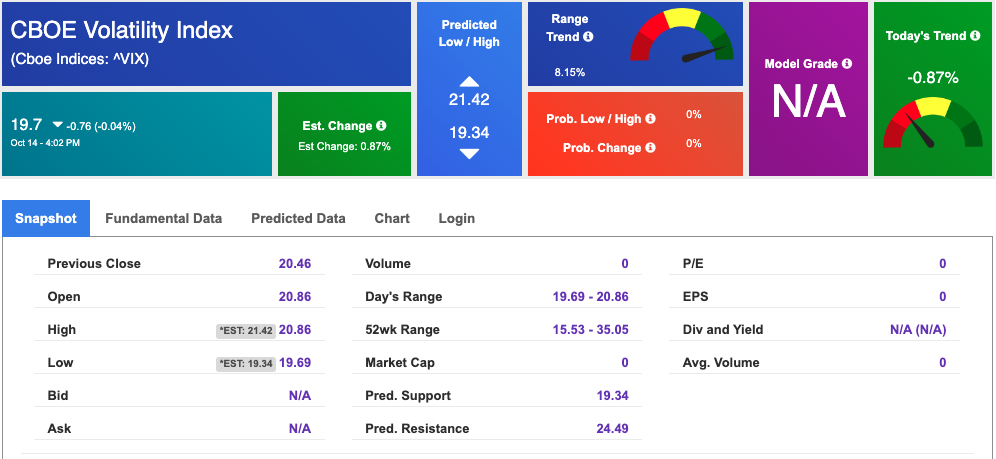
The CBOE Volatility Index (^VIX) is priced at $19.7 down 0.04% at the time of publication, and our 10-day prediction window shows mixed signals. Prediction data is uploaded after the market close at 6 p.m., CST. Today’s data is based on market signals from the previous trading session.
Please share this Tradespoon Market Commentary with your friends.
![]()

![]()
Comments Off on


Tradespoon Tools make finding winning trades in minute as easy as 1-2-3.
Our simple 3 step approach has resulted in an average return of almost 20% per trade!

