 Special Offer: Try the 'WeeklyTrader Membership' for ONLY $37!
CLICK HERE TO LEARN MORE
Special Offer: Try the 'WeeklyTrader Membership' for ONLY $37!
CLICK HERE TO LEARN MORE
Stocks ended the day mixed, reflecting the market’s cautious sentiment after a volatile end to last week. Friday’s trading saw the Dow Jones Industrial Average inch higher during a triple witching day, a quarterly event where stock options, stock index futures, and stock index options expire simultaneously, leading to heightened trading volumes and volatility.
Investor optimism was bolstered by S&P Global’s preliminary PMI survey, which indicated that U.S. business activity grew at its fastest pace in 26 months in June. The flash services PMI rose to 55.1, surpassing expectations of 53.7, while the manufacturing PMI climbed to 51.7, contrary to predictions of a dip to 51. These figures signal robust expansion in both the services and manufacturing sectors, contributing to a positive market sentiment.
Despite the encouraging PMI data, the broader economic outlook remains mixed. A monthly economic indicator suggests that U.S. economic growth will cool in the latter half of 2024, with consumers becoming more pessimistic due to elevated interest rates and persistent inflation. The housing market faces significant challenges, with existing-home sales in May hitting their lowest level since 2020 and prices reaching record highs. While current market conditions are tough for buyers, some relief may be on the horizon as the market adjusts.
This week, markets opened with continued optimism about artificial intelligence driving company profits, particularly for chipmaker Nvidia, which has been a major contributor to gains over the past year. However, chipmakers were among the biggest decliners on Monday as investors rotated into other sectors. Nvidia shares fell 6.7%, Super Micro Computer dropped 8.7%, Broadcom declined 3.7%, and Microchip Technology decreased by 2.6%.
Hopes that the Federal Reserve will cut interest rates later this year have also supported market sentiment. Investors are closely watching the latest reading of the core personal consumption expenditures index, the Fed’s preferred inflation measure, which is due on Friday. Bond yields remained relatively stable, with the yield on the benchmark 10-year Treasury note at 4.251% and the two-year yield at 4.738%.
This week, global markets are focusing on a series of economic data releases and significant corporate developments. Reports include consumer confidence on Tuesday, new home sales on Wednesday, weekly jobless claims and quarterly GDP on Thursday, and the core PCE data on Friday. These reports are critical for investors navigating a landscape defined by key economic indicators and shifts in the business world.
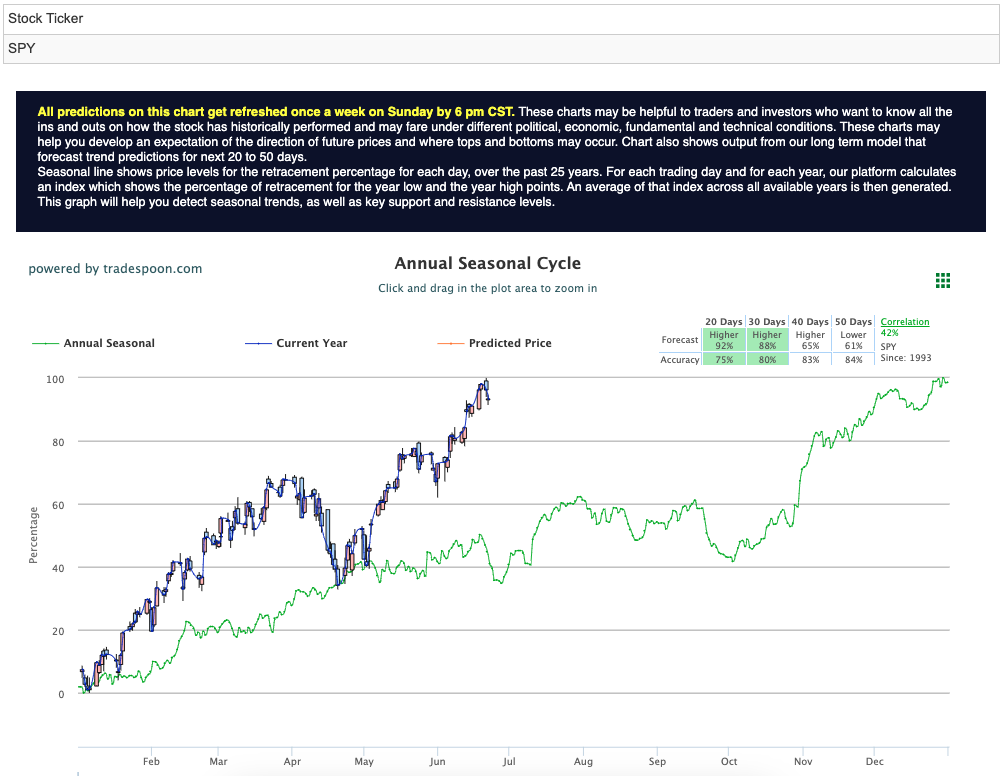
Looking ahead, the SPY may face resistance in the $540-$550 range, but it also has support around $500-$510 in the short term. These levels suggest potential opportunities for continued market progress, with expectations of sustained upward momentum in the coming months. For reference, the SPY Seasonal Chart is shown below:
Despite the mixed economic signals, some investors remain bullish. With inflation coming within expectations and a better-than-expected earnings season, there is cautious optimism about the market’s potential. However, risks remain as the economy shows signs of cooling, unemployment ticks up, and small banks face potential failures due to exposure to commercial and residential real estate.
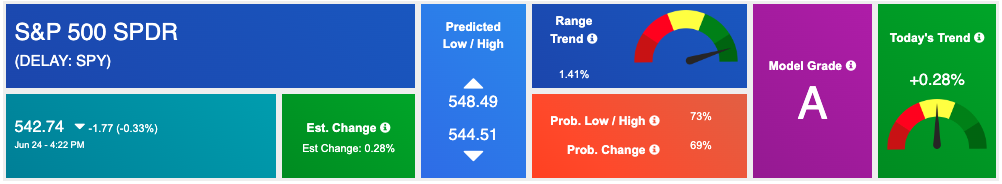
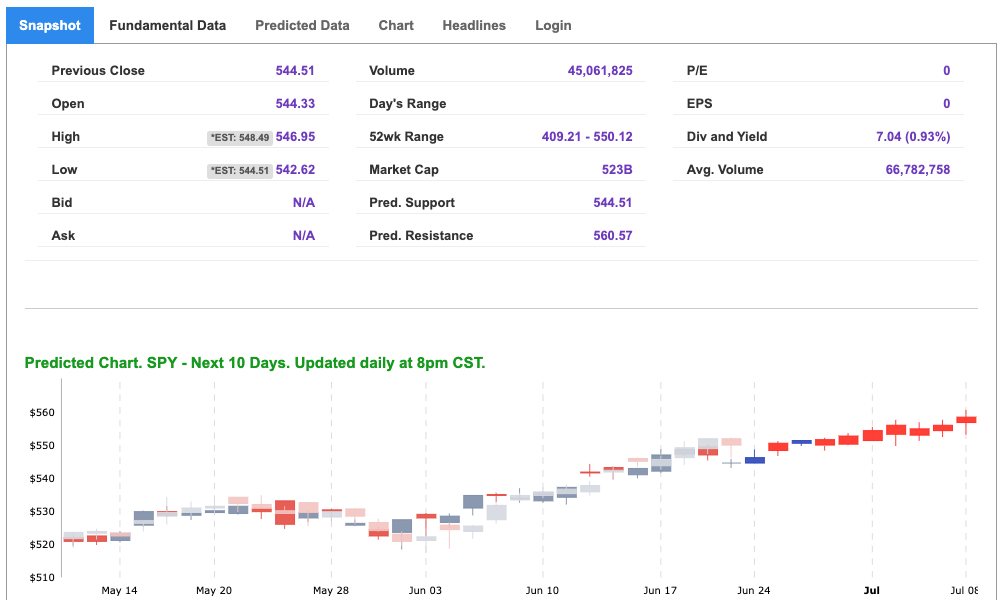
Using the “SPY” symbol to analyze the S&P 500 our 10-day prediction window shows a near-term positive outlook. Prediction data is uploaded after the market closes at 6 p.m. CST. Today’s data is based on market signals from the previous trading session.
Note: The Vector column calculates the change of the Forecasted Average Price for the next trading session relative to the average of actual prices for the last trading session. The column shows the expected average price movement “Up or Down”, in percent. Trend traders should trade along the predicted direction of the Vector. The higher the value of the Vector the higher its momentum.
*Please note: At the time of publication Vlad Karpel does have a position in the featured symbol, mu. Our featured symbol is part of your free subscription service. It is not included in any paid Tradespoon subscription service. Vlad Karpel only trades his money in paid subscription services. If you are a paid subscriber, please review your Premium Member Picks, ActiveTrader, or MonthlyTrader recommendations. If you are interested in receiving Vlad’s picks, please click here.
West Texas Intermediate for Crude Oil delivery (CL.1) is priced at $81.75 per barrel, up 1.26%, at the time of publication.
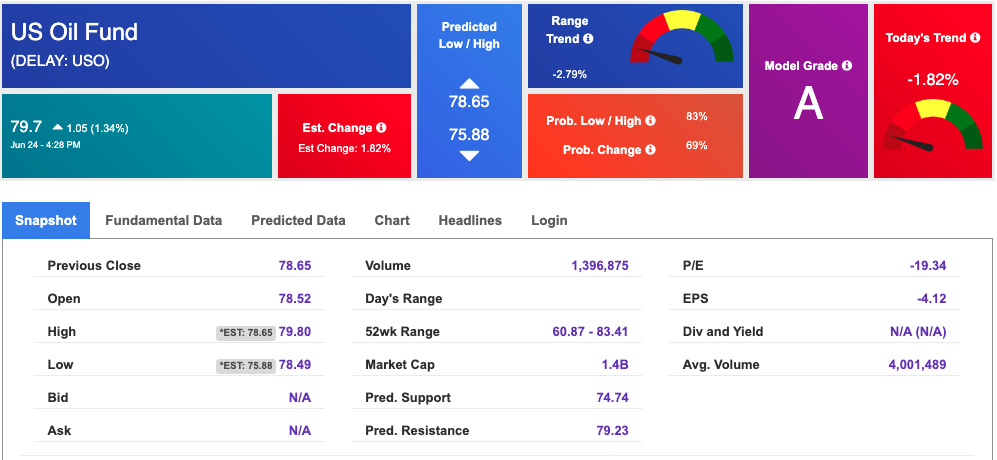
Looking at USO, a crude oil tracker, our 10-day prediction model shows mixed signals. The fund is trading at $79.7 at the time of publication. Prediction data is uploaded after the market close at 6 p.m., CST. Today’s data is based on market signals from the previous trading session.
The price for the Gold Continuous Contract (GC00) is up 0.69% at $2347.30 at the time of publication.

Using SPDR GOLD TRUST (GLD) as a tracker in our Stock Forecast Tool, the 10-day prediction window shows mixed signals. The gold proxy is trading at $215.83 at the time of publication. Vector signals show -0.08% for today. Prediction data is uploaded after the market close at 6 p.m., CST. Today’s data is based on market signals from the previous trading session.
The yield on the 10-year Treasury note is down at 4.237% at the time of publication.
The yield on the 30-year Treasury note is down at 4.366% at the time of publication.
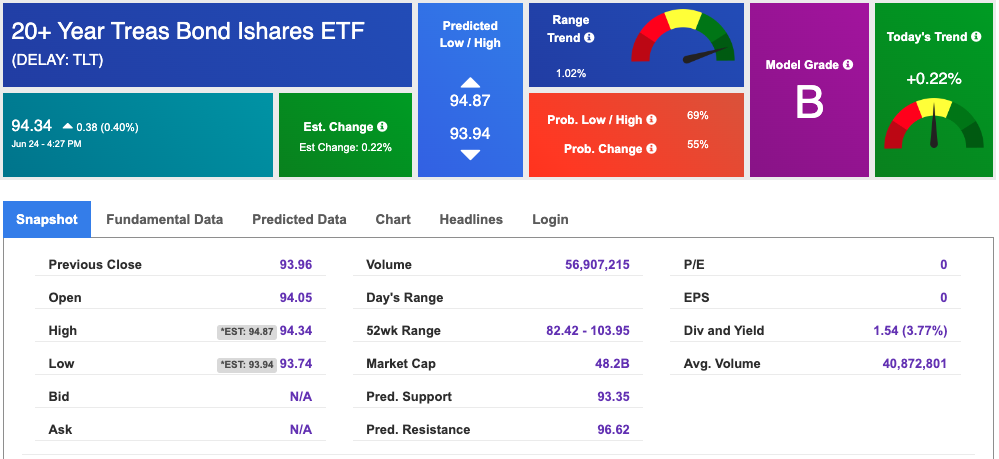
Using the iShares 20+ Year Treasury Bond ETF (TLT) as a proxy for bond prices in our Stock Forecast Tool, we see mixed signals in our 10-day prediction window. Prediction data is uploaded after the market close at 6 p.m., CST. Today’s data is based on market signals from the previous trading session.
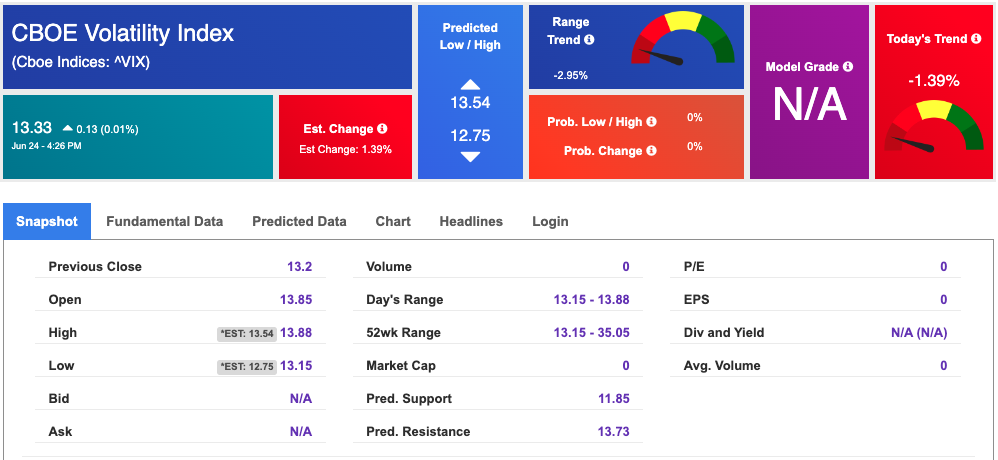
The CBOE Volatility Index (^VIX) is priced at $14.33 up 0.01% at the time of publication, and our 10-day prediction window shows mixed signals. Prediction data is uploaded after the market close at 6 p.m., CST. Today’s data is based on market signals from the previous trading session.
Please share this Tradespoon Market Commentary with your friends.
![]()

![]()
Comments Off on


Tradespoon Tools make finding winning trades in minute as easy as 1-2-3.
Our simple 3 step approach has resulted in an average return of almost 20% per trade!

