 Special Offer: Try the 'SpreadTrader Membership' for ONLY $37!
CLICK HERE TO LEARN MORE
Special Offer: Try the 'SpreadTrader Membership' for ONLY $37!
CLICK HERE TO LEARN MORE
The stock market experienced sharp volatility on Monday as Wall Street anxiously awaited updates on former President Donald Trump’s trade policies. The Dow Jones Industrial Average initially plummeted by more than 600 points before clawing back a significant portion of its losses, closing notably lower but avoiding a complete rout. The S&P 500 and Nasdaq Composite also declined as investors grappled with renewed tariff fears.
Markets tumbled at the open following the White House’s reaffirmation over the weekend of a looming Tuesday deadline for 25% tariffs on imports from Mexico and Canada, alongside a 10% tariff on imports from China. However, a partial rebound occurred after Trump and Mexican President Claudia Sheinbaum Pardo announced a temporary truce, delaying the tariffs by a month to allow for further negotiations. As part of the agreement, Mexico pledged to deploy 10,000 troops to the U.S. border to address immigration concerns, a move designed to placate U.S. policymakers.
Amid the turbulence, the CBOE Volatility Index (VIX), often referred to as Wall Street’s ‘fear gauge,’ surged over 20%, briefly surpassing the critical threshold of 20—a level typically associated with heightened uncertainty and market stress.
Manufacturing Sector Shows Signs of Recovery, But Tariffs Cloud Outlook
In a rare positive economic signal, the U.S. manufacturing industry—long considered a bellwether of economic health—showed its first expansion in months. The Institute for Supply Management’s (ISM) Purchasing Managers Index (PMI) rose to 50.9 in January, up from 49.2 in December, surpassing economists’ expectations of 49.6. A reading above 50 indicates growth in the manufacturing sector, offering some relief to those concerned about industrial slowdowns.
However, this positive development was largely overshadowed by tariff concerns, which continue to pose a significant threat to long-term economic growth. With potential new trade barriers on the horizon, businesses remain wary of rising costs and supply chain disruptions that could stifle investment and consumer confidence.
Earnings Season: A Mixed Bag for Investors
Last week, markets entered a consolidation phase, balancing cautious optimism with ongoing macroeconomic uncertainties. Earnings reports painted a mixed picture:
On the global stage, monetary policies took divergent paths. The Federal Reserve maintained interest rates at 4.25%-4.50%, emphasizing a data-driven approach. Meanwhile, the European Central Bank (ECB) cut its deposit rate by 25 basis points to 2.75% in an effort to stimulate the stagnating eurozone economy. ECB President Christine Lagarde reaffirmed confidence in returning inflation to the 2% target by 2025, signaling that further stimulus measures may remain on the table. This policy divergence strengthened the U.S. dollar while putting pressure on the euro, influencing capital flows across global markets.
Market Outlook: Cautious Optimism Amid Sideways Trading
From a broader technical perspective, the market remains in a neutral stance, reflecting a balance between inflation coming in within expectations and an earnings season that has, so far, outperformed forecasts. However, risks persist, primarily due to concerns that interest rates may stay elevated for longer than anticipated, coupled with a gradual uptick in unemployment rates.
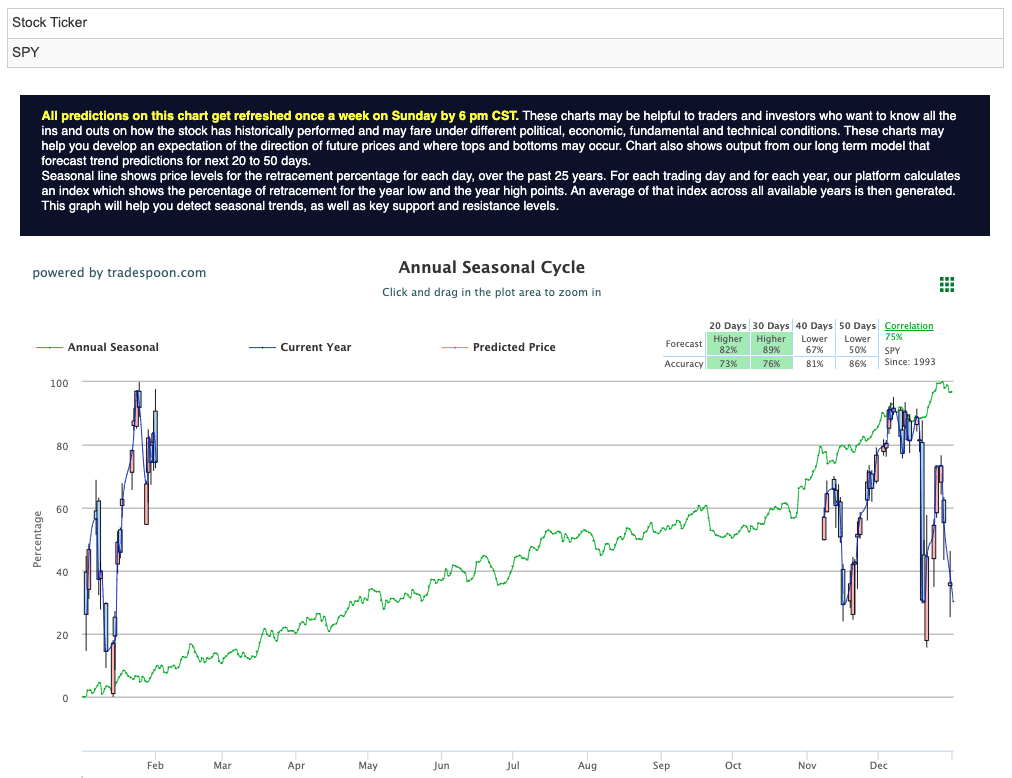
The SPDR S&P 500 ETF Trust (SPY) could see a rally extending to the $620-$640 range in the coming months, with short-term support levels positioned between $560-$580. Given prevailing conditions, the market is expected to continue trading sideways in the short term while maintaining its longer-term upward trajectory. For reference, the SPY Seasonal Chart is shown below:
Adding to the complexity of the current market landscape, geopolitical uncertainties remain a key concern. The potential imposition of 25% tariffs on Mexican and Canadian imports, including oil, could introduce fresh headwinds, further complicating an already fragile global trade environment.
With economic data showing resilience yet uncertainty lingering, investors are bracing for a period of heightened volatility. The market’s near-term trajectory will likely be shaped by trade negotiations, central bank policy decisions, and corporate earnings trends. While optimism persists, caution remains warranted as Wall Street navigates a landscape filled with both opportunity and risk.
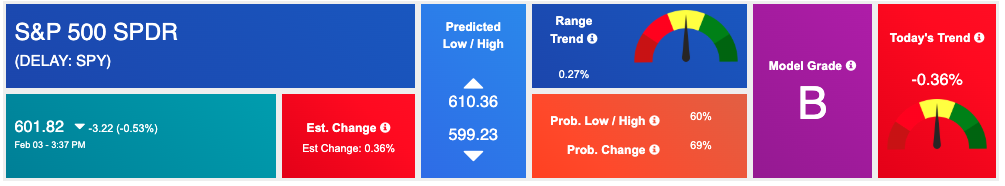
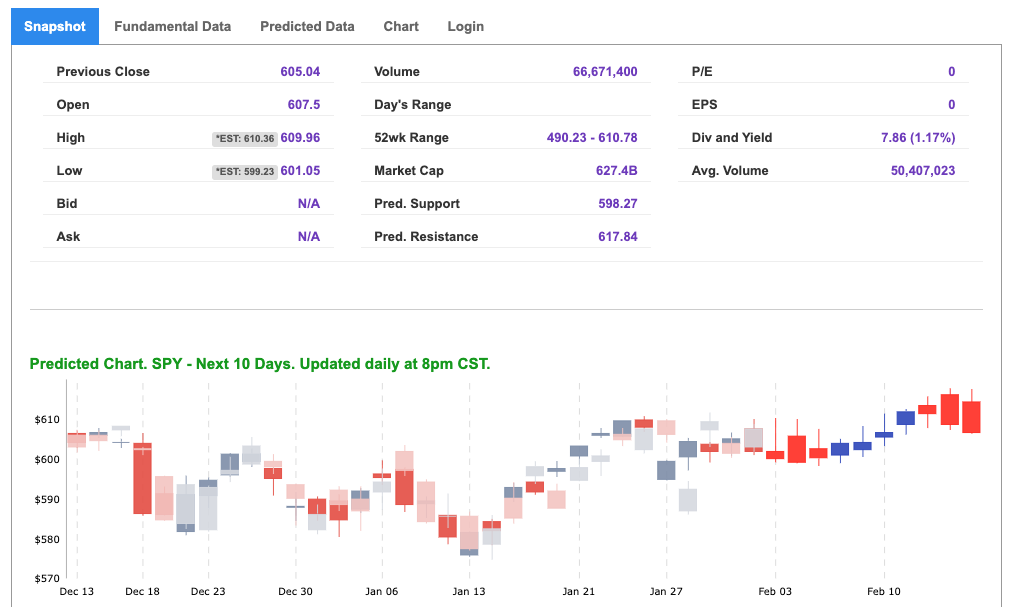
Using the “SPY” symbol to analyze the S&P 500 our 10-day prediction window shows a near-term positive outlook. Prediction data is uploaded after the market closes at 6 p.m. CST. Today’s data is based on market signals from the previous trading session.
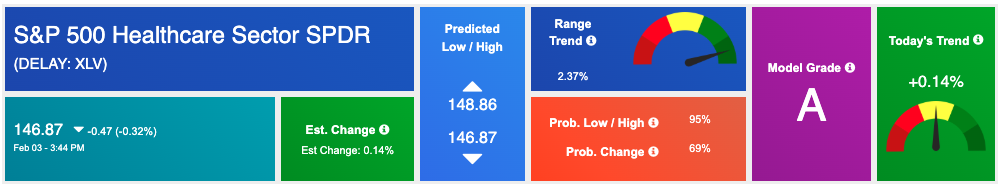
Our featured symbol for Tuesday is Health Care Select Sector SPDR Fund – XLV, which is showing a steady vector in our Stock Forecast Toolbox’s 10-day forecast.
The symbol is trading at $146.87 with a vector of +0.14% at the time of publication.
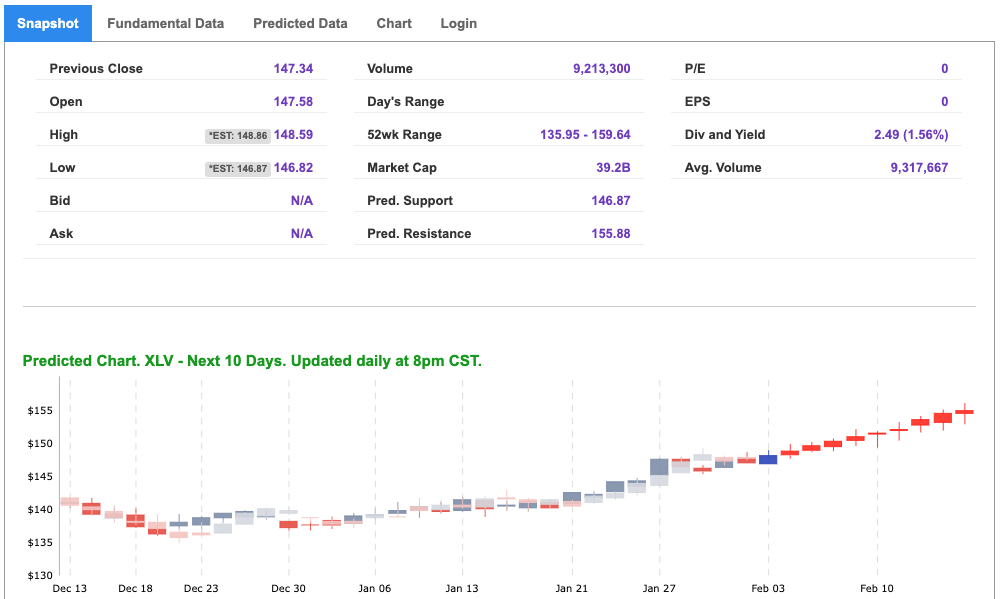
10-Day Prediction data is uploaded after the market close at 6 p.m., CST. Today’s data is based on market signals from the previous trading session.
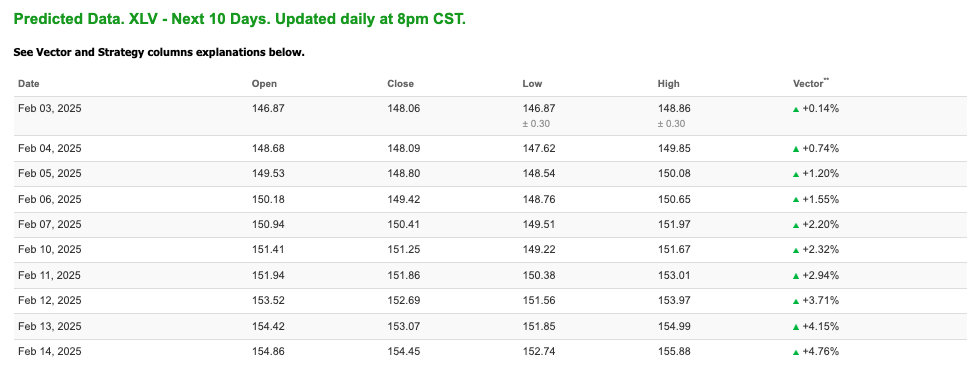
Note: The Vector column calculates the change of the Forecasted Average Price for the next trading session relative to the average of actual prices for the last trading session. The column shows the expected average price movement “Up or Down”, in percent. Trend traders should trade along the predicted direction of the Vector. The higher the value of the Vector the higher its momentum.
*Please note: At the time of publication Vlad Karpel does have a position in the featured symbol, XLV. Our featured symbol is part of your free subscription service. It is not included in any paid Tradespoon subscription service. Vlad Karpel only trades his money in paid subscription services. If you are a paid subscriber, please review your Premium Member Picks, ActiveTrader, or MonthlyTrader recommendations. If you are interested in receiving Vlad’s picks, please click here.
West Texas Intermediate for Crude Oil delivery (CL.1) is priced at $72.35 per barrel, down 0.33%, at the time of publication.

Looking at USO, a crude oil tracker, our 10-day prediction model shows mixed signals. The fund is trading at $77.82 at the time of publication. Prediction data is uploaded after the market close at 6 p.m., CST. Today’s data is based on market signals from the previous trading session.
The price for the Gold Continuous Contract (GC00) is up 0.54% at $2,850.20 at the time of publication.
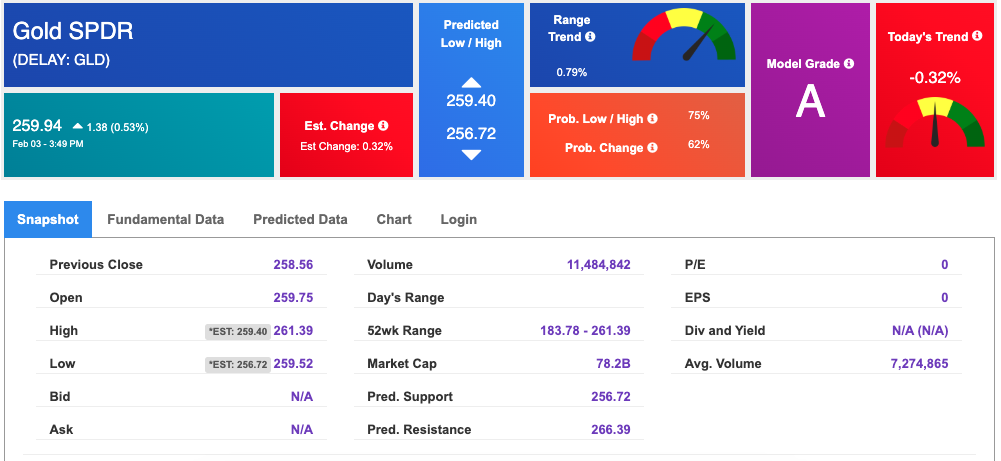
Using SPDR GOLD TRUST (GLD) as a tracker in our Stock Forecast Tool, the 10-day prediction window shows mixed signals. The gold proxy is trading at $259.94 at the time of publication. Vector signals show -0.32% for today. Prediction data is uploaded after the market close at 6 p.m., CST. Today’s data is based on market signals from the previous trading session.
The yield on the 10-year Treasury note is up at 4.564% at the time of publication.
The yield on the 30-year Treasury note is up at 4.797% at the time of publication.
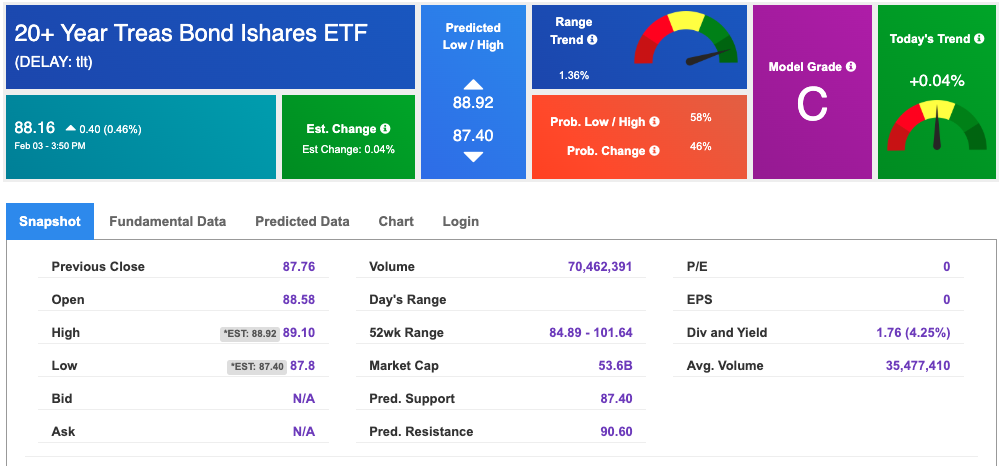
Using the iShares 20+ Year Treasury Bond ETF (TLT) as a proxy for bond prices in our Stock Forecast Tool, we see mixed signals in our 10-day prediction window. Prediction data is uploaded after the market close at 6 p.m., CST. Today’s data is based on market signals from the previous trading session.
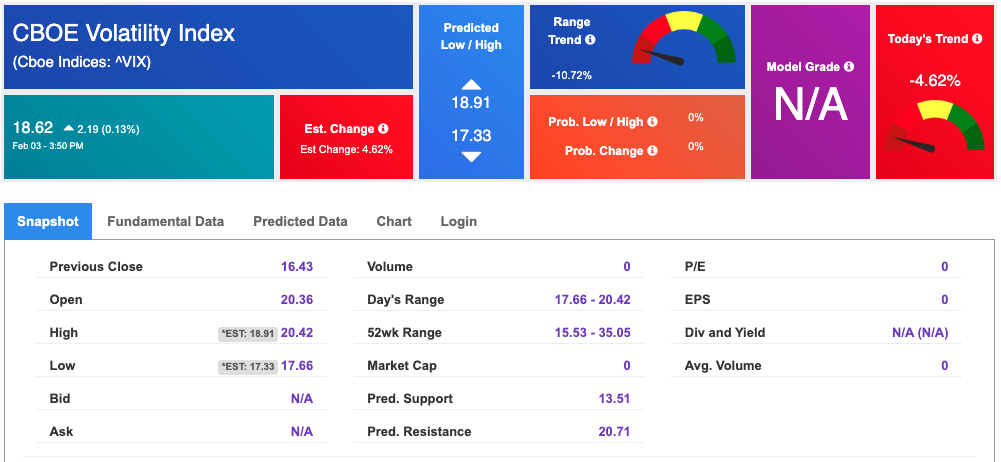
The CBOE Volatility Index (^VIX) is priced at $18.62 up 0.13% at the time of publication, and our 10-day prediction window shows mixed signals. Prediction data is uploaded after the market close at 6 p.m., CST. Today’s data is based on market signals from the previous trading session.
Please share this Tradespoon Market Commentary with your friends.
![]()

![]()
Comments Off on


Tradespoon Tools make finding winning trades in minute as easy as 1-2-3.
Our simple 3 step approach has resulted in an average return of almost 20% per trade!

